Structure in Chemistry
Macromolecules
MM7. Molecular Weight
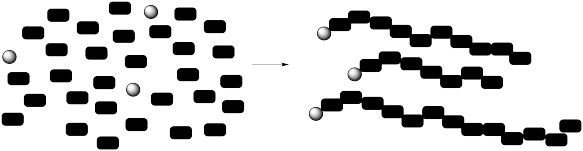
Macromolecules are very large molecules. Their molecular weights can range from the thousands to the millions. Typically they are constructed from small, repeating units linked together in some way.
Describing the molecular weight of a polymer is not as straightforward as it is in a small molecule. The fact that each macromolecule is built by joining together a large number of monomers complicates things. Exactly how many monomers are there in one polymer molecule? Twenty? Twenty-five? Thirty? Each of those possibilities would have a very different molecular weight.
This is generally the case in macromolecules, whether we are dealing with commercial or biological samples. Polymers are grown, often through the action of some "initiator" that picks up a monomer and starts knitting together a chain. What if one of the initiators starts a little later than the others? What if one of the chains grows a little faster than the others? What if something goes wrong and one chain stops growing?
As a result of a number of factors, polymers generally display a distribution of molecular weights representing a distribution of chain lengths. There is no exact molecular weight. Instead, an average must be determined.
Problem MM7.1.
Explain the general relationship between degree of polymerization and molecular weight of the chain.
Problem MM7.2.
Calculate the molecular weight of each of the following polymer chains. For simplicity, assume the end groups are just hydrogen atoms in each case.
a) polystyrene (PS) with DP = 1,000
b) polylactide (PLA) with DP = 200
c) poly(ethylene oxide) (PEO) with DP = 50
d) polypropylene (PP) with DP = 100,000
There are many different ways of estimating the average molecular weight of a polymer. These methods fall into two categories, giving rise to two different estimates of the average molecular weight.
In some techniques, the total weight of a sample is measured followed by a determination of the number of molecules present. The molecular weight is just the total weight divided by the number of molecules. This quantity is called the number average molecular weight, or Mn.
Problem MM7.3.
a) A sample weighing 3.205 g is determined to contain 5.50 x 10⁻⁴ moles. What is Mn?
b) A sample weighing 1.315 g is determined to contain 1.25 x 10⁻³ moles. What is Mn?
c) A sample weighing 0.225 g is determined to contain 3.20 x 10⁻⁷ moles. What is Mn?
A classic example of this type of measurement is a freezing point depression. A pure liquid freezes at a specific temperature, but impurities in the liquid tend to interfere with crystal formation, lowering the freezing point. The change in freezing point depends on the number of molecules present in the impurity. In this approach, a measured amount of polymer would be dissolved in a specific quantity of toluene and the freezing point would be measured very carefully. The polymer in this context is acting as an impurity. The change in freezing point would indicate the number of molecules (or moles) of the impurity. The average molecular weight could then be calculated.
Other techniques rely on measurements that depend on the relative size of the macromolecules, rather than the number of them. The quantity determined this way is called the weight average molecular weight, or Mw.
A classic example of this type of measurement is a light-scatterring experiment. A beam of laser light is shone into a solution of polymer. Some of the light is scattered when it encounters polymer molecules, and the interference patterns in the scattered light can be decoded to give information about the particle size.
Typically, techniques that depend on particle size are more heavily influenced by the larger particles, and so Mw > Mn. The closer these numbers are to each other, the more uniform the partciles must be. The more different they are, the broader the distribution present. Consequently, the ratio Mw/Mn, historically called the polydispersity index (PDI), is an important indicator of how uniform the molecules are in size. "Polydisperse" as an adjective means that there is a wide distribution of sizes, as opposed to "monodisperse", meaning everything is the same size.
IUPAC has recently decided that the term "polydispersity index" should be abandoned in favour of the more concise term, dispersity (Đ).
Problem MM7.4.
Determine the polydispersity in each of the following cases.
a) Mn = 2,105; Mw = 2,408
b) Mn = 102,365; Mw = 124,710
c) Mn = 56,300; Mw = 87,530
d) Mn = 8,105; Mw = 14,220
e) Mn = 1,170,000; Mw = 1,899,000
These days, two of the most common techniques for estimating molecular weight are 1H NMR spectroscopy and size exclusion chromatography (although other techniques such as light scattering are still used). We'll take a closer look at NMR analysis in a minute. First we'll start with a simplified view of size exclusion chromatography (SEC) or, as it is sometimes called, gel permeation chromatography (GPC).
In SEC, a sample is sent through a column containing a porous gel. Generally, smaller molecules that wander into the pores within the gel take longer to get through the column. Larger molecules that can't fit into the pores emerge sooner. The effluent from the column is monitored by a technique such as UV-Vis spectroscopy or refractive index. The response from this detector changes over time, with a stronger response indicating more molecules are being detected as they come out of the column. The output from the instrument shows a distribution, not unlike a bell curve, indicating the distribution of molecular weights by comparison with a standard sample.
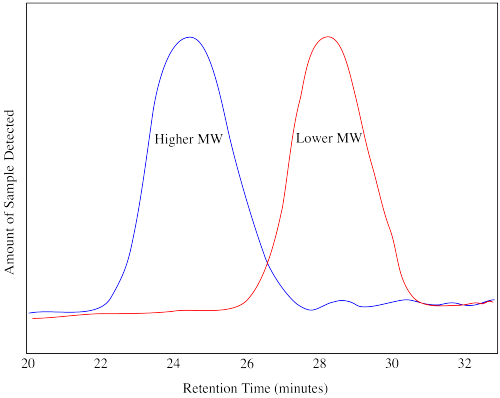
The drawing above shows you what a chromatogram or trace would look like for two different samples, one of higher molecular weight and one of lower molecular weight. The retention time in a GPC trace does not directly indicate the molecular weight of the polymer. A calibration has to be run. In a calibration, polymers of known molecular weight are run through the GPC and their chromatograms are obtained. The GPC trace of an unknown polymer, run on the same instrument under the same conditions, is then compared to the standard ones. Software is used to estimate the molecular weight and the polydispersity.
Problem MM7.5.
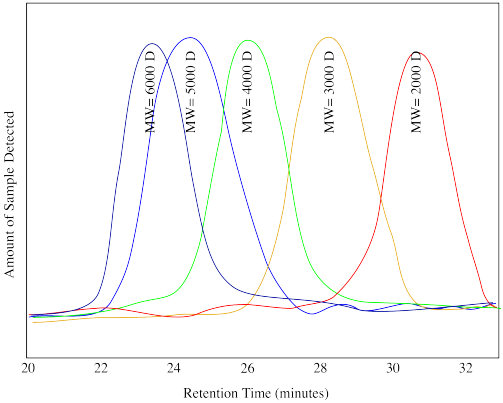
Suppose the following drawing shows calibration traces for the chromatogram shown above (D stands for Daltons, another name for the units "g/mol"). Estimate the molecular weight of
a) the low molecular weight unknown.
b) the high molecular weight unknown.
Problem MM7.6.
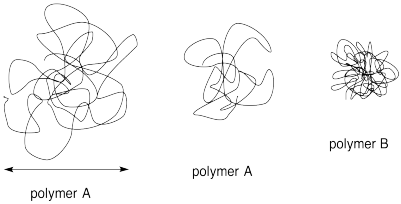
SEC, which is based on the size of a coiled polymer molecule, can sometimes give misleading estimates of the molecular weight. Explain why with the help of the following diagram.
NMR spectroscopy is a method that uses magnetic fields and radio waves to detect different kinds of atoms in a sample. 1H NMR detects the hydrogen atoms in a sample. It is conceptually very similar to MRI used in hospitals and clinics. In the experiment, the sample is placed in a very strong magnetic field (somewhere on the order of a hundred thousand times greater than the earth's magnetic field on the planet's surface). Radio waves are sent through the sample. Most of them pass straight through, but some of them are absorbed by the hydrogen atoms.
The result of the NMR experiment is an NMR spectrum. A spectrum is really just a graph. On the x axis, it shows all the possible frequencies of the radio waves that were sent through the sample. On the y axis, it shows the absorption level: in other words, how much of the radio waves at each frequency that were absorbed by the sample. Did a particular frequency of radio waves just pass right through the sample? The absorbance at that frequency would be zero. If a particular frequency is absorbed, there will be a "peak" on the graph (a high point) at that frequency.
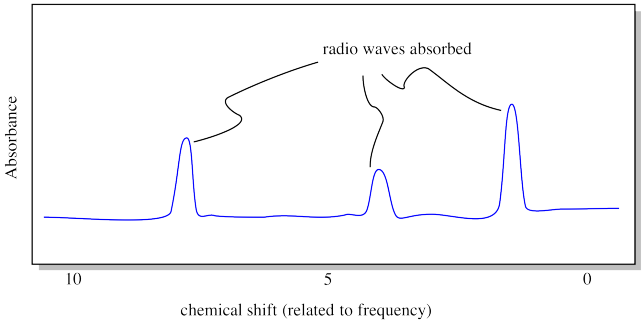
Each peak in the NMR spectrum corresponds to a hydrogen in a different environment. Maybe the hydrogen is attached to an oxygen atom, or a carbon atom, and so on. In the drawing shown above, the spectrum indicates three different locations for hydrogen atoms in the molecule. Note that "frequency" in NMR is called "chemical shift", for historical reasons. The units of chemical shift are parts per million, or ppm, for reasons that have to do with the mechanics of the experiment.
But how does that help us with molecular weight? We're getting there.
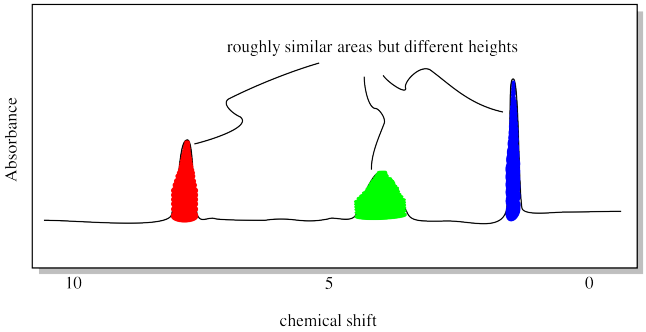
1H NMR spectroscopy also allows us to measure how many hydrogens we have of each type, at least in a relative sense. It could tell us we have equal amounts of hydrogens in these three locations, or maybe twice as many in one location as there are in the other two. The relationship is pretty simple: the more hydrogens there are in a particular location, the bigger the peak associated with them. That's because if one hydrogen atom absorbs one radio frequency photon, two hydrogen atoms would absorb two radio frequency photons. That's twice as much. The peak should be twice as big for two hydrogens as it would be for one hydrogen.
What do we mean by "bigger", though? It turns out that the height of the peak doesn't really tell us anything. What matters is the area of the peak. That's because even for two seemingly identical protons in a sample, there are lots of factors that mess with the radio frequency absorbed, ever so slightly. So, if a specific hydrogen in one molecule absorbs a radio photon at 1.7005 ppm, a hydrogen in the exact same position in a second molecule might absorb at 1.7007 ppm. There are lots of complicated reasons for that. The result, however, is that NMR peaks get smeared out a little bit, so that it isn't the height that matters, but the area, which is the sum of a whole lot of very similar radio frequencies absorbed by those identical hydrogens in different molecules.
So we need to measure the areas of those peaks. Fortunately, NMR spectrometers are equipped with software that can do this. Classically, the instrument would print a red line across the spectrum. The red line would hop up every time it passed over a peak. The amount of each hop corresponded to the relative area of the peak.
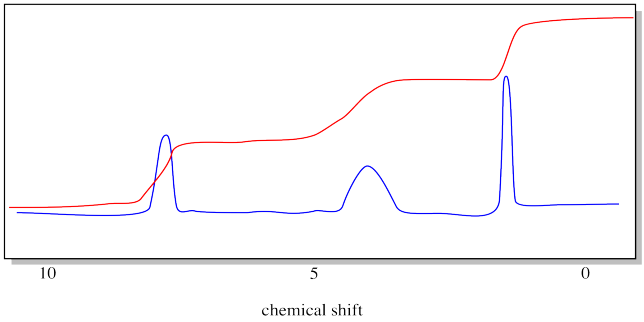
Notice that we don't even bother to label the y axis anymore. It doesn't tell us anything, anyway.
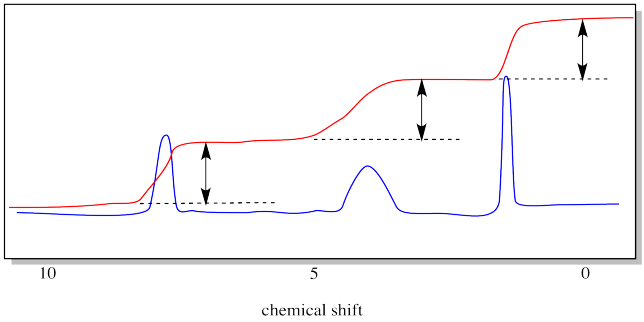
The drawing below emphasizes what we are measuring with the integral line. It is the vertical distance that the integral line hops up as it passes a peak. That distance is called the "integral". In this case, the integrals of the three peaks are all about equal.
Now it's time to see how 1H NMR spectroscopy can reveal molecular weight through a measurement called "end group analysis".
Consider the polymer poly(ethylene glycol), or PEG. PEG is commonly used in medicine. By itself it can be used as a laxative, depending on its molecular weight. It can also be mixed with pharmaceuticals; it helps control side effects and spreads the medicinal effect over a longer time, so you don't have to take the medicine as often.
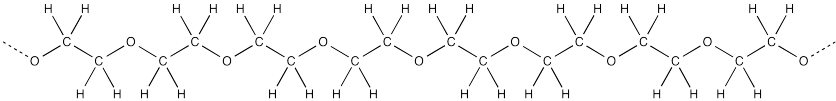
Frequently, there is an OH group at both ends of the chain. In the middle, the polymer is made of CH2CH2O repeating units.
PEG can be thought of as a polymer of ethylene glycol (or ethane-1,2-diol). The structure of ethylene glycol is provided below. The structure of ethylene glycol shows two different kinds of hydrogens. There are the hydrogens along the chain, attached to carbons, and there are hydrogens at the ends of the chain, attached to oxygens. The 1H NMR spectrum of ethylene would show a different peak for each of those types of hydrogens. There would be two peaks.
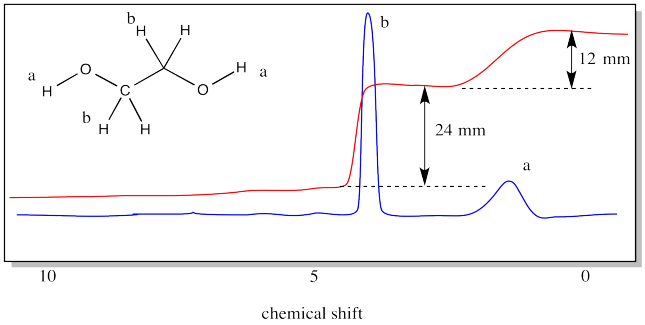
The spectrum also shows an integration line. We have measured the integral for each peak. It looks like a 2:1 ratio, because the vertical distance in one case is 24 mm and in the other case it is only 12 mm. Even if you don't know anything else about NMR spectroscopy, you can see that the peak around 4 ppm must correspond to the hydrogens on the carbons, whereas the peak around 1 ppm must correspond to the hydrogens on the oxygens. That's because there are four hydrogens on the carbons and only two on the oxygens. The ratio is 2:1.
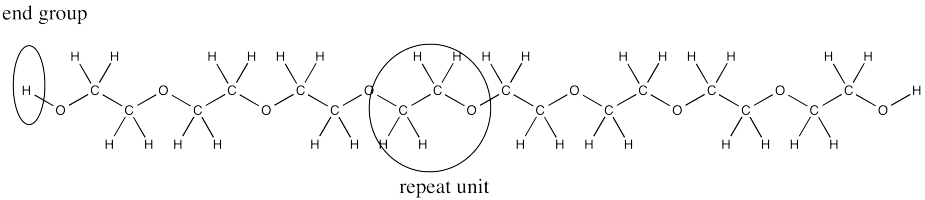
The structure of PEG is pretty similar to that of ethylene glycol, except that it has a bunch of units strung in a row. The NMR spectrum of PEG is pretty similar to that of ethylene glycol, too.
In end group analysis, we compare the integral of a hydrogen found at the end of the chain to the integral of one found along the chain, in the repeating unit. In PEG, the end group is the OH group at either end. The repeat unit corresponds to the hydrogens on the carbons.
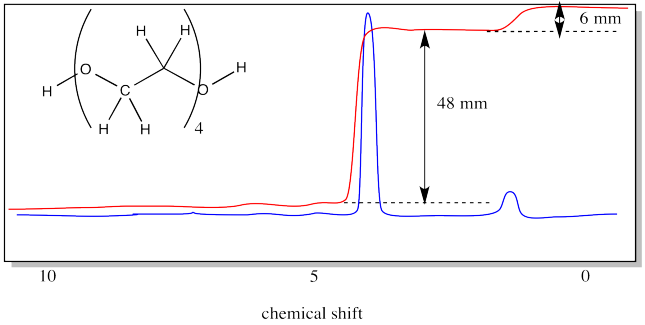
In the case above, there are two hydrogen in the end groups (one at each end). The four repeat units have four hydrogens each, for a total of sixteen. The integration ratio should be 16:2, or 8:1. The measured ratio is 48:6, or 8:1.
Contrast that result with the case of ethylene glycol, in which there isbasically just one repeat unit. The ratio in the oligomer (short polymer) is four times greater than the ratio in the monomer. That's because there are four times as many repeat units in the oligomer. We sometimes call the number of repeat units in the chain the "degree of polymerization".
Problem MM7.7.
Expand the above structure of the 4-unit PEG oligomer to show the whole chain, rather than just the repeat unit in parentheses.
Problem MM7.8.
What would be the integration ratio in the following oligomer?
To estimate chain length in NMR, a peak must be found from one of the repeating units along the chain as well as a peak from an end group, found only at the end of the chain. The integration of the repeating unit to the end group indicates the average number of repeating units per polymer. This technique essentially provides Mn.
Problem MM7.9.
What is the molecular weight of the 4-unit PEG oligomer, the NMR spectrum of which was shown above?
In the next example, you are going to see a peculiar fact of life. The truth is, OH groups often don't show up well in 1H NMR spectroscopy (for complicated reasons). That can complicate things. To get around that problem, people often make polymers in such a way that there is a different end group, other than an OH, so that the integration ratio can be measured more easily.
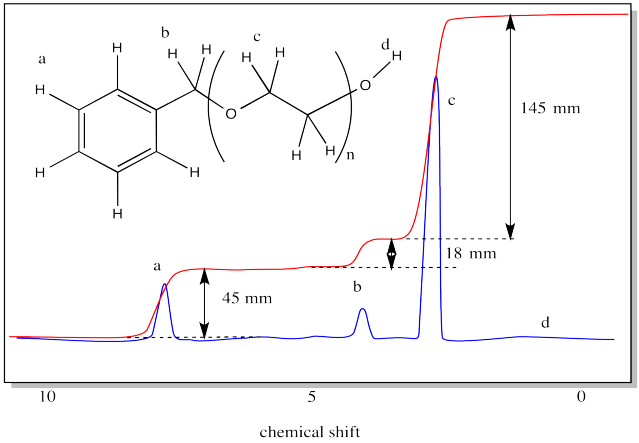
Problem MM7.10.
Use the integration ratio in the following spectrum to estimate the degree of polymerization.
This site is written and maintained by Chris P. Schaller, Ph.D., College of Saint Benedict / Saint John's University (with contributions from other authors as noted). It is freely available for educational use.

Structure & Reactivity in Organic, Biological and Inorganic Chemistry by Chris Schaller is licensed under a Creative Commons Attribution-NonCommercial 3.0 Unported License.
Send corrections to cschaller@csbsju.edu
Navigation: