
Structure & Reactivity
Nuclear Magnetic Resonance Spectroscopy
NMR2D.4. NOESY
Nuclear Overhauser Effect Spectroscopy, or NOESY, shows through-space interactions within the molecule, rather than the through-bond interactions seen in the other methods. This method is especially useful for determining stereochemical relationships in a molecule. In two stereoisomers, the atoms are all connected in exactly the same order, through exactly the same bonds. A COSY or an HMBC spectrum wouldn't be able to distinguish between these isomers.
However, in a relatively rigid conformer, one hydrogen in one stereoisomer may be locked on the same side of the molecule as another group. If information could be transmitted from that group to that proton, we would know that they were near each other in space, and we would know which stereoisomer we have.
For example, there are three different stereoisomers of lactide. Lactide is a product of the fermentation of corn and soybeans; it can be polymerized to make a sort of brittle plastic, PLA. PLA is used for food packaging because it can be composted in industrial and municipal waste management sites.
How would we know which isomer we were dealing with? Telling L-LA and D-LA apart may be difficult. They are enantiomers of each other and so they have the same physical properties. However, provided someone else has already figured out which is which, we could use optical rotation and compare the value we measure to the reported one.
On the other hand, we could easily tell the meso-LA from either the D-LA or the L-LA, because it would be the diastereomer of either of them. It would have different physical properties, including different NMR spectra. We could carefully compare the spectrum below to reported spectra for meso-LA and L-LA (or D-LA) to see which isomer we have.

On the other hand, we could just take a NOESY spectrum. In meso-LA, the methyl on one end of the molecule is on the same face of the ring as the hydrogen on the other end. We may be able to see that through-space relationship. We wouldn't see it in L-LA or D-LA, though.

Just like in a COSY spectrum, all of the peaks that show up along the diagonal of a NOESY spectrum are simple the ones we would see in a regular 1H spectrum. The peaks that show up off the diagonal tell us about through-space relationships. In this case, the relationship between the methyl hydrogen and the alpha hydrogen suggest we have a sample of meso-LA.
ROESY is a similar method that works better in some cases.
Problem NMR2D4.1.*
Draw the relative stereochemistry of this compound based on the NOESY spectrum.
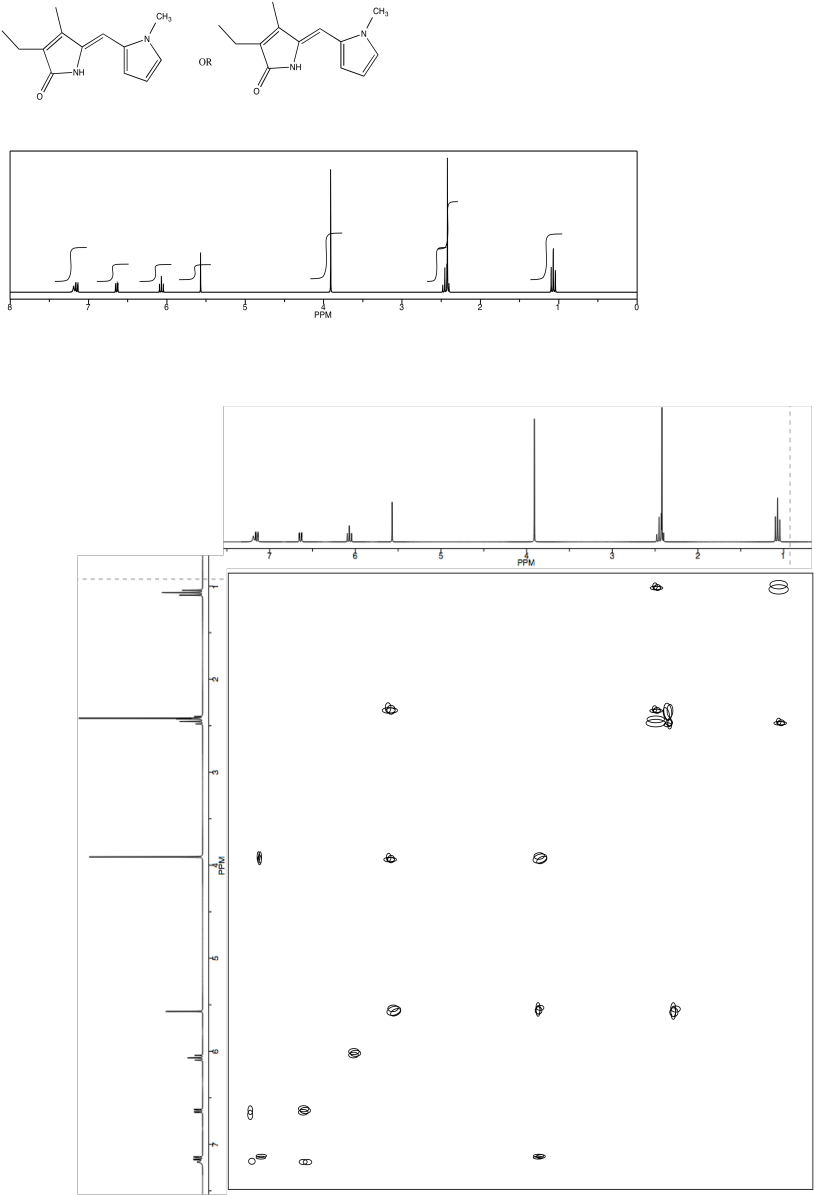
Problem NMR2D4.2.*
Use NOESY to determine which isomer below is present.

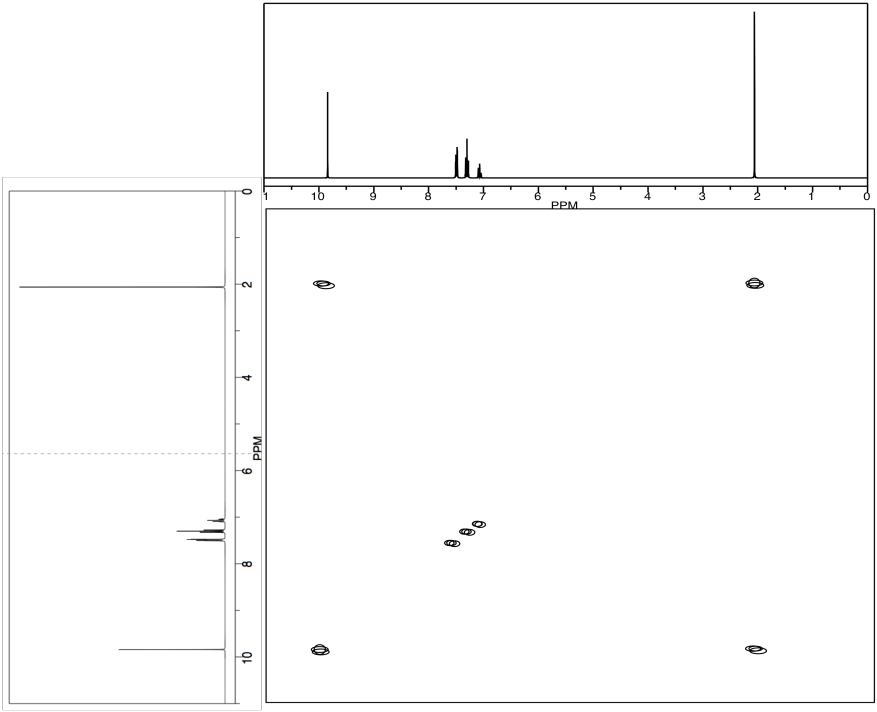
Problem NMR2D4.3.*
Acetanilide has two different conformers. They do not easily interconvert.

a) Explain (using pictures) why there isn't free rotation around the amide bond.
b) Use double headed arrows to predict nOe correlations.
c) Use the NOESY spectrum to determine which conformer is observed at room temperature.
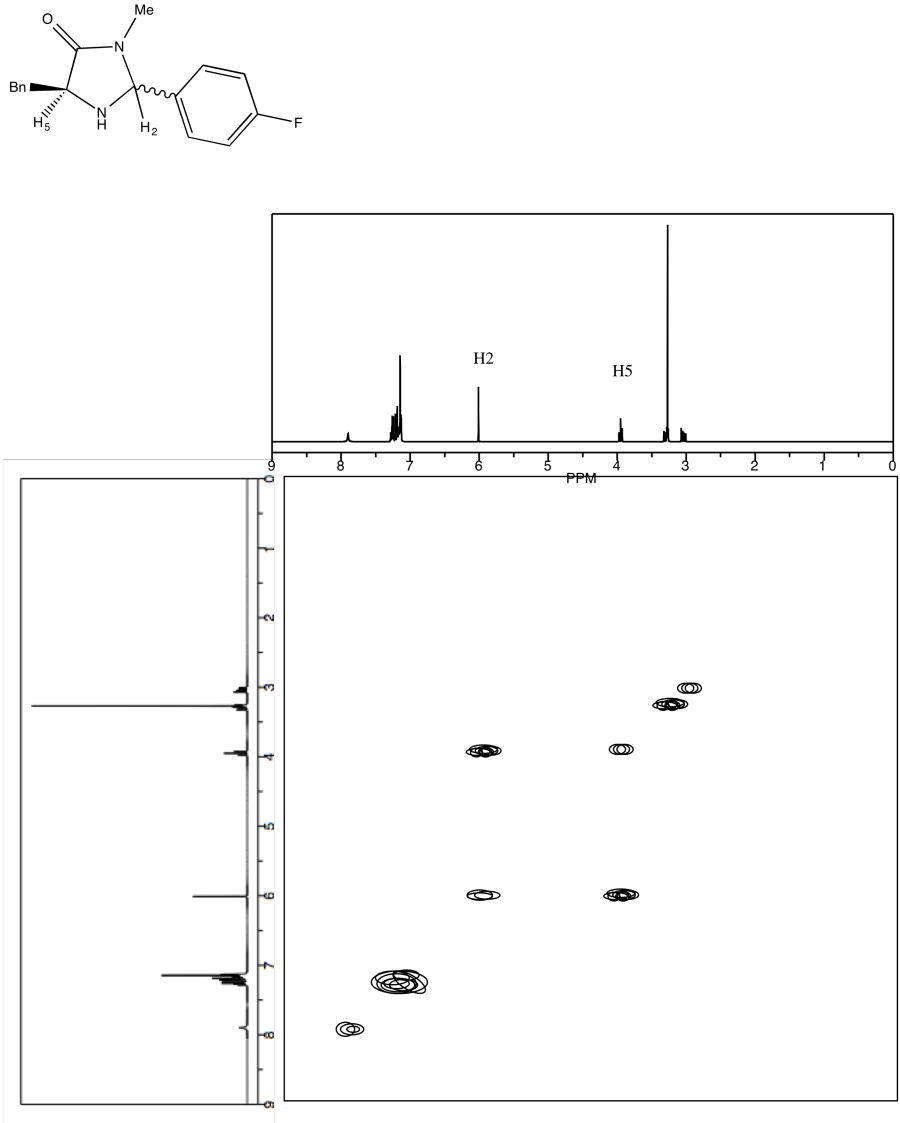
Problem NMR2D4.4.*
a) Complete the table of 1H assignments for the following compound:
b) Use the NOESY to assign the relative configuration.
"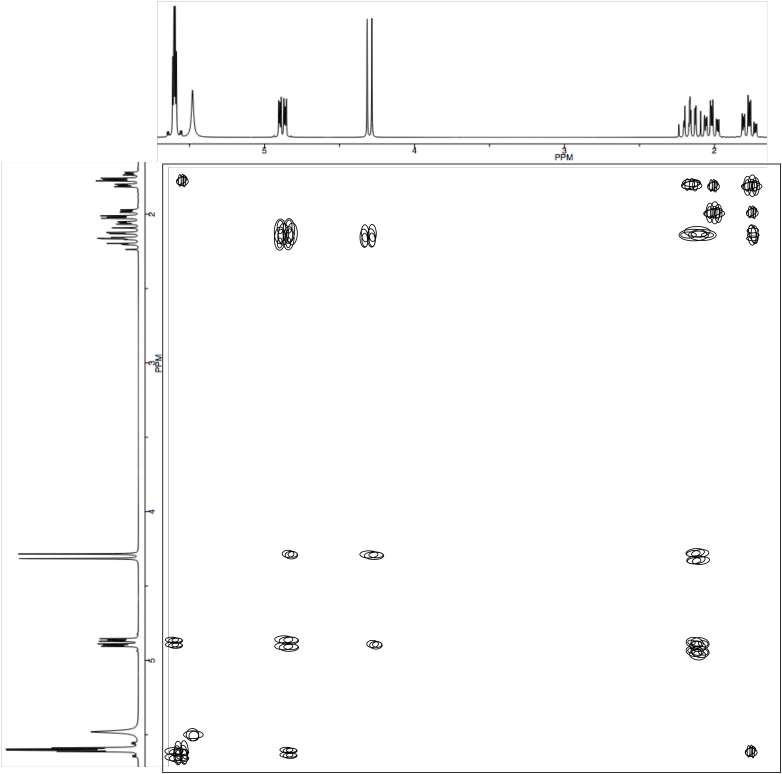
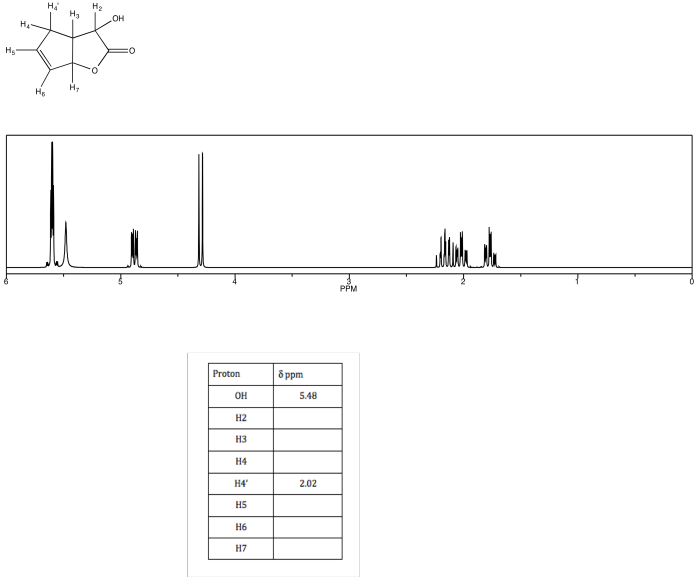
Problem NMR2D4.5.*
Draw the relative stereochemistry of this compound based on the NOESY spectrum.
Problem NMR2D4.6.*
Dictyosphaeric Acid A is an antimicrobial compound
isolated from an undescribed Penicillium sp. in an alga
Dictyosphaeria versluyii collected in Fiji.
(Bugni, Janso, Williamson,
Feng, Bernan, Greenstein, Carter, Maiese and Ireland, J. Nat. Prod.
2004, 67, 1396-1399.)
a) Circle all the chiral centers.

The researchers used nOe (ROESY) to determine stereochemical relationships.
| H | ROESY |
| 1 | 2, 14 |
| 2 | 1, 3 |
| 3 | 2 |
| 4 | |
| 5 | |
| 6 | 8b, 9b |
| 7a | 7b |
| 7b | 7a, 14 |
| 8a | |
| 8b | 6 |
| 9a | 10, 15 |
| 9b | 6, 10, 15 |
| 10 | 9a, 9b, 15 |
| 11 | |
| 12 | |
| 13 | |
| 14 | 1, 7b |
| 15 | 9a, 9b, 10 |
b) Use the data to put the substituents on this structure with wedges/dashes.
c) Include key nOe correlations with the curved arrows.
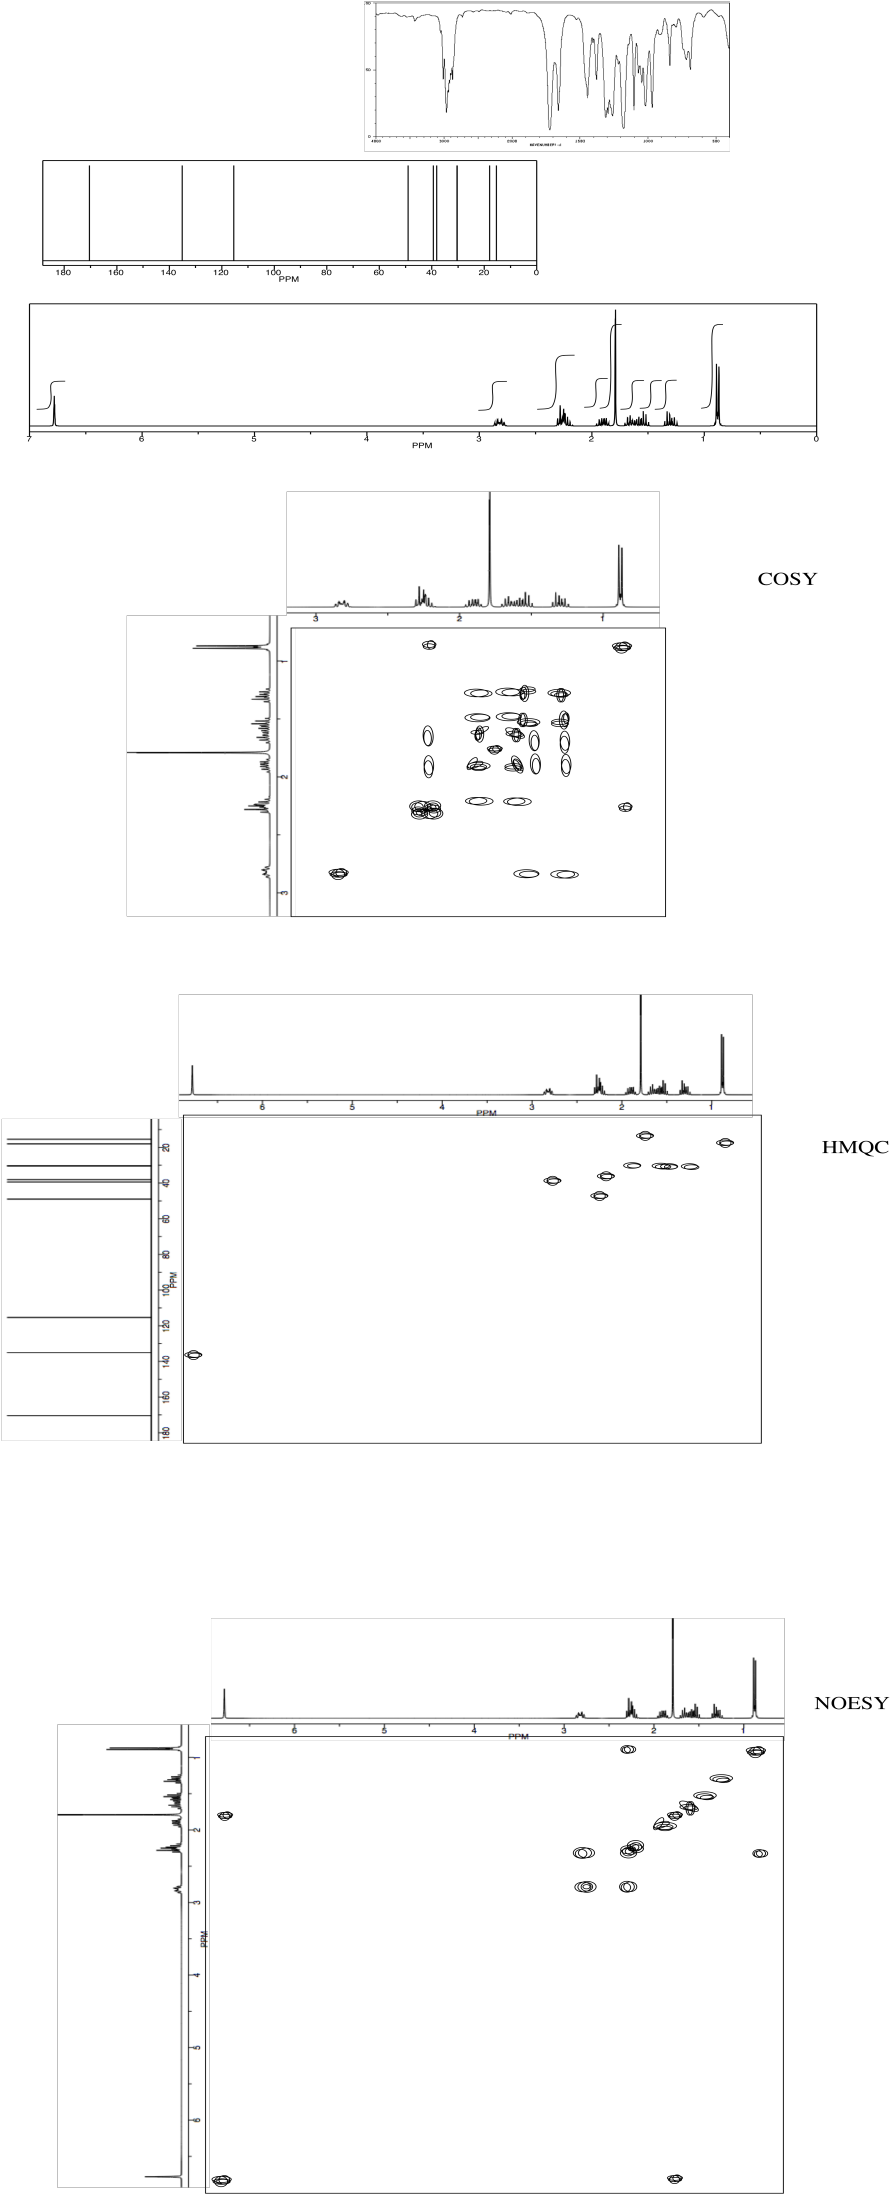
Problem NMR2D4.7.*
Analyse the following data and propose a structure for the compound, formula C10H14O2.
*Sources:
Selected IR spectra from SDBS (National Institute of Advanced Industrial Science and Technology, Japan, Spectral Database for Organic Compounds, http://sdbs.db.aist.go.jp/sdbs/cgi-bin/cre_index.cgi, accessed December, 2015).
1H NMR, 13C NMR and NOESY spectra simulated.
Contributions from Kate Graham, College of Saint Benedict | Saint John's University
This site was written by Chris P. Schaller, Ph.D., College of Saint Benedict / Saint John's University (retired) with other authors as noted on individual pages. It is freely available for educational use.

Structure & Reactivity in Organic, Biological and Inorganic Chemistry by Chris Schaller is licensed under a Creative Commons Attribution-NonCommercial 3.0 Unported License.
Send corrections to cschaller@csbsju.edu
Navigation:
Useful Charts for NMR identification.