Reactivity in Chemistry
Mechanisms of Glycolysis
GL2. Overview of Glycolysis
In the cell, carbohydrates are used as a source of energy. The carbohydrates might have been recently ingested, or they might be released from long-term storage. Carbohydrates can be stored in the form of glycogen, in animals, or starch, in plants. Glycogen and starch are biomacromolecules. They are composed of large collections of glucose molecules bonded together (or enchained) into one, much bigger molecule. They have different structures: starch is composed of very long chains of glucose molecules, whereas glycogen is a highly branched structure, more like a coral or a tree. Specific enzymes can be used to release glucose molecules, one by one, from these structures.
Glycolysis is a biochemical pathway in which glucose is consumed and ATP is produced. ATP is like the spring that powers all of the windup toys of the cell. To compress that spring, energy has to be expended, so glucose is sent through a series of reactions that eventually release some energy that can be used for this purpose. Once the spring is charged, it can release its energy rapidly.
The consumption of glucose is associated with the catabolic process of respiration. In respiration, glucose is combined with oxygen, the reactants are converted to carbon dioxide and water, and energy is released. We could write that reaction as follows:
C6H12O6(s) + 6 O2(g) → 6 CO2g + 6 H2O(l) + energy
However, that reaction is really the sum total of three different processes. In the first process, glycolysis, glucose is broken down partway, forming pyruvate. Some energy is released by the process. In the second process, the tricarboxylic acid (TCA) cycle or citric acid cycle, pyruvate is broken down further to release carbon dioxide. Again, some energy is produced by this process. Both of these pathways produce ATP. Both of these pathways also produce NADH. In the third process, oxidative phosphorylation, NADH is used to power an "electron transport chain", releasing additional energy that is harnessed in order to make more ATP. The TCA cycle will be covered in a later chapter in this section of the book. Oxidative phosphorylation is not discussed until the Reactivity III section of the book, which is concerned with single electron processes.
When looking at biochemical pathways, it is helpful to have a map of the process to get an overview of how all the steps fit together. Glycolysis is sometimes presented in two parts, so two maps are shown below. The first part, Phase One, actually consumes energy; this part is the initial investment needed for a later return.
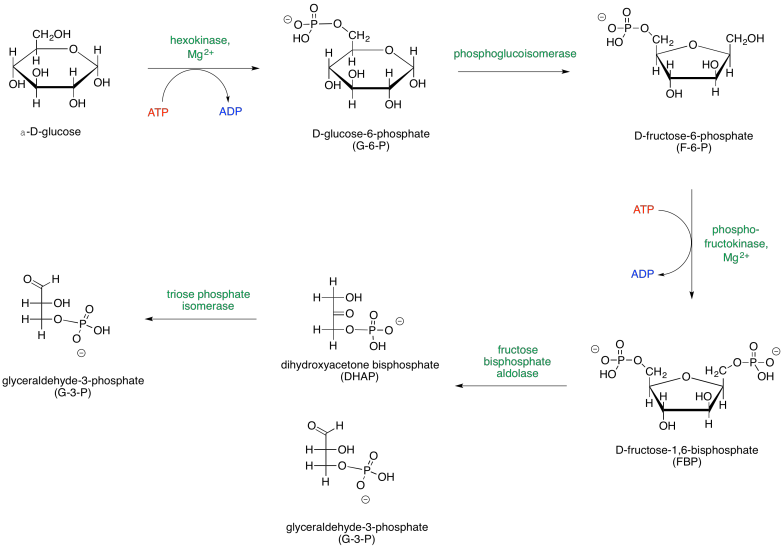
Figure GL2.1. Phase One of glycolysis leads to the scission of a six-carbon sugar into two three-carbon sugars.
The map of phase one of glycolysis starts with glucose and leads eventually to the formation of two G3P molecules. Glucose is the initial input, and G3P is the final output; everything else along the way is just an intermediate that is consumed soon after it is made. Along the way, additional inputs to the reaction are shown in red, and outputs are shown in blue. Enzymes and other catalytic factors, which are not consumed by the reaction, are shown in green.
Problem GL2.1.
Provide a net equation for phase one of glycolysis that shows all of the inputs on one side of the reaction arrow and all of the outputs on the other side of the reaction arrow.
Note that the first phase of glycolysis actually consumes ATP rather than producing it. This initial investment of energy leads to a later return. The second part of glycolysis, Phase Two, occurs after the glucose has been cleaved in half; this phase leads to the release of energy.
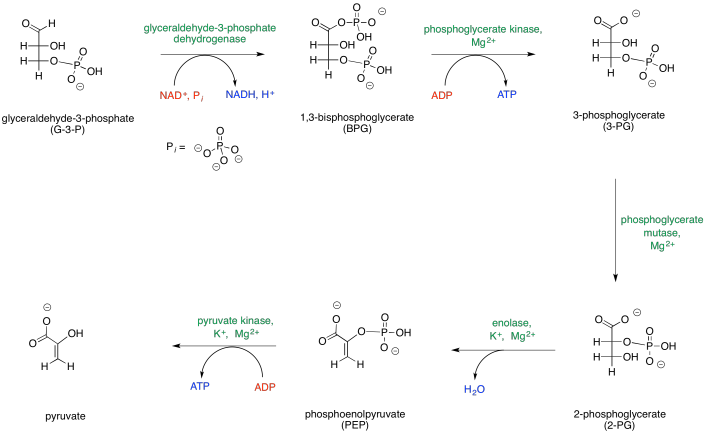
Figure GL2.2. Phase two of glycolysis leads to production of ATP.
The map of phase two of glycolysis starts with G3P and leads eventually to the formation of pyruvate. G3P is the initial input, and pyruvate is the final output; everything else along the way is just an intermediate that is consumed soon after it is made. Along the way, additional inputs to the reaction are shown in red, and outputs are shown in blue. Enzymes and other catalytic cofactors are shown in green.
Problem GL2.3.
Provide a net equation for phase one of glycolysis that shows all of the inputs on one side of the reaction arrow and all of the outputs on the other side of the reaction arrow.
Problem GL2.4.
Provide a net equation for glycolysis (both phases combined) that shows all of the inputs on one side of the reaction arrow and all of the outputs on the other side of the reaction arrow.
It helps to be able to think about sugars in both cyclic and open chain forms. Phase One can be presented in an alternative way that depicts the carbohydrates as open chains rather than rings.
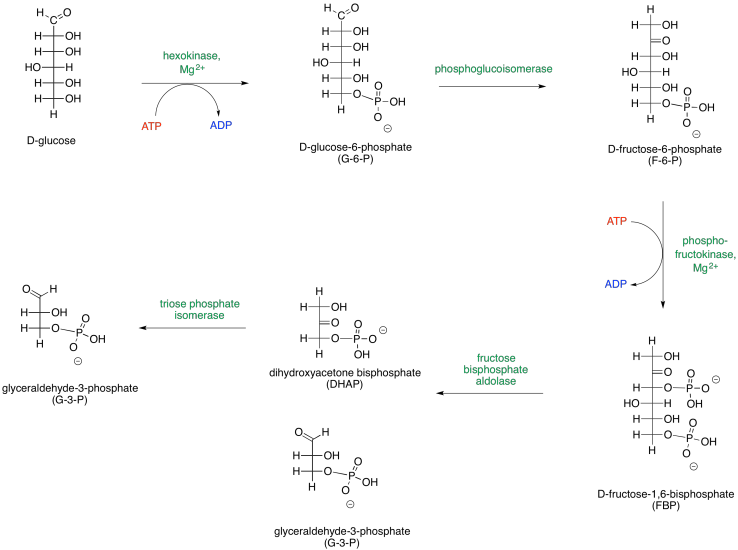
Figure GL2.3. An alternative presentation of Phase One, showing the sugars in their open-chain forms.
These two different ways of depicting carbohydrates takes into account that most carbohydrates are dynamic structures. Rather than having one form, they have different forms that can interconvert between each other, and all of these forms are present at equilibrium. One form dominates, and that's usually a ring. For glucose, the six-membered ring or "pyranose" form makes up about 99% of molecules in solution. In water, the beta-form, in which the rightmost OH group in the Haworth projection is cis- to the CH2OH group, makes up about two thirds of the pyranose form. In nonpolar environments the ratio is reversed, with the alpha-form dominating, in which the rightmost OH group in the Haworth projection is trans- to the CH2OH group.
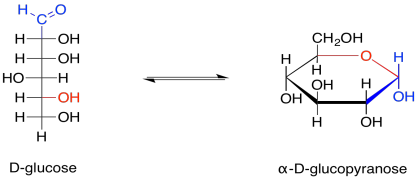
Figure GL2.4. Equilibrium between the open chain and a cyclic form of glucose.
The open chain form makes up less than one percent of glucose molecules in solution. Nevertheless, sometimes it is the open-chain form that actually undergoes reaction, so it is useful to think of carbohydrates both ways.
Problem GL2.4.
Provide a mechanism for the formation of glucopyranose from the chain form of glucose. Assume biological conditions, such as the presence of a lysine residue to assist in proton transfer.
Problem GL2.5.
In the map of glycolysis, the α-D-glucopyranose form is shown. Draw β-D-glucopyranose.
Problem GL2.6.
Show the hemiacetals that would form in the following cases.

Problem GL2.7.
Show the pyran rings (six-membered rings with oxygen) that would form in the following cases.

Problem GL2.8.
Show the furan rings (five-membered rings with oxygen) that would form in the following cases.

This site was written by Chris P. Schaller, Ph.D., College of Saint Benedict / Saint John's University (retired) with other authors as noted on individual pages. It is freely available for educational use.

Structure & Reactivity in Organic,
Biological and Inorganic Chemistry by
Chris Schaller
is licensed under a
Creative Commons Attribution-NonCommercial 3.0 Unported License.
Send corrections to cschaller@csbsju.edu
This material is based upon work supported by the National Science Foundation under Grant No. 1043566.
Any opinions, findings, and conclusions or recommendations expressed in this material are those of the author(s) and do not necessarily reflect the views of the National Science Foundation.
Navigation: