Minnesota Radon Maps
THESE
MAPS AND TEXT UNDER REVISION SUMMER 2010.
CAUTION: USE THESE MAPS WITH CARE.
MAPS can only answer questions about the general properties of the data's
spatial values and variation. For example, the Minnesota radon indoor map cannot
tell you what the radon is in your house; it can only give a range of likely
results that you might get if you made a radon measurement in the lowest
lived-in level of your home. Other maps are designed to provide an estimate of
the average radon (useful in judging health risk in areas), the percent of homes
in excess of the current USEPA action level, radon in the outside air, and the
potential for saving lives through radon mitigation. Care has been taken to base
these maps on the best available independently-gathered randomized and unbiased
measurements of radon or authoritative sources in the case of the national
CLICK on MAP
ICON to get to a page that gives details
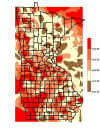
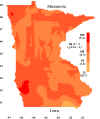
These maps only show average
values. Indoor radon varies substantially at scales not shown on these maps. It is not
wise to use these maps to predict the radon in an individual house. Rather, these maps can
be used to estimate the average indoor radon on a local or regional scale.
ATD maps rely on long term(>90 day) radon measurements using alpha track
detectors while CC maps are based on short-term (2day) measurements using charcoal
canister radon detectors. Contour maps are created from point data sets (radon value and
location). Others maps generated by taking the average within a geopolitical boundary
(county/state_province/country).
Click on maps to see a larger
image and details.
Back to the MRP
Homepage

Questions/Comments, e-mail:
Dr. Steck
Last revised :
16 June, 2010
Visitor since
06/16/10
since
06/16/10
Disclaimer
The views and opinions expressed on the web sites hosted on this server are strictly those
of the author.
The contents of the web sites on this server have not been reviewed or
approved by the College of St. Benedict|St. John's University.