Henry Jakubowski, Ph.D., Professor, Chemistry Department, College of Saint Benedict/Saint John's University
The questions below are based on data, graphs, and figures from the following article:
Thermodynamics of the GTP-GDP-operated Conformational Switch of Selenocysteine-specific Translation Factor SelB. Alena Paleskava, Andrey L. Konevega and Marina V. Rodnina . The Journal of Biological Chemistry, 287, 27906-27912 (2012). doi: 10.1074/jbc.M112.366120 .
Background/Review Questions:
a. Looking at the calorimetry cells above, what components would most likely be placed in the reference cell, sample cells, and syringe?
Answer: reference cell contains buffer solution, sample cell contains protein (which is probably difficult to concentrate sufficiently to place in be used in the syringe), and the syringe contains the GXP nucleotide.
b. ITC is very sensitive and can detect minute enthalpy changes when a titrant is injected into the reference cell. List possible physical and chemical processes which might lead to enthalpy changes on on injection of a titrant into the control cell.
answer: dilution, protonation changes, ligand binding, conformational changes and chemical reactions.
c. What is the most logical control experiment that you would perform? How would you correct the experimental derived enthalpy changes for the those see in the control case?
answer: inject ligand (GTP, GDP, etc) into the sample cell containing just buffer solution (which is also placed in the reference cell. Subtract the DH for the dilutions from the DH for the experimental DHs.
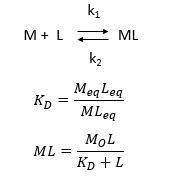
d. Consider the following simple equilibrium for the interaction of a ligand L with a macromolecule M characterized by the dissociation constant Kd as shown below.
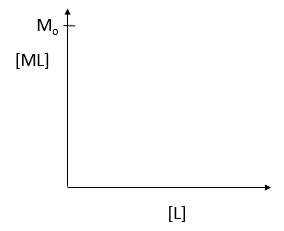
where M is the concentration of the free macromolecule, L is the concentration of free ligand, and ML is the concentration of complex. For dissociable binding interactions, Kd is as important as pka for a ionizable proton from an acid. An equation for ML as a function of Mo, L and Kd is shown above. Kd values are typically determined from binding experiment when Mo, the total amount of M is much less than free L. From the equation of ML above, draw a graph of ML vs L on the axes below.
e. Simplify the equation for ML as a function of L for each of the following conditions:
- L << Kd L = Kd L >> Kd
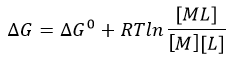
The equilibrium constant, Keq = 1/Kd, is related to the standard free energy change, DG0 using the following equation:
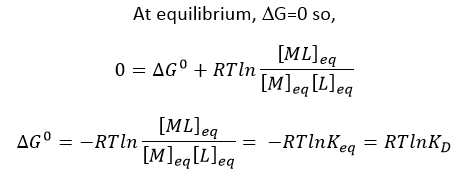
f. What is the DG at equilibrium? Using this information, derive an equation that gives the relations between DG0 and Keq as well as Kd.
Answer:
Questions based on article:
1. Answer the following questions based on the ITC thermograms for binding of GTP to SelB (A) and GDP to SelB (B) below.
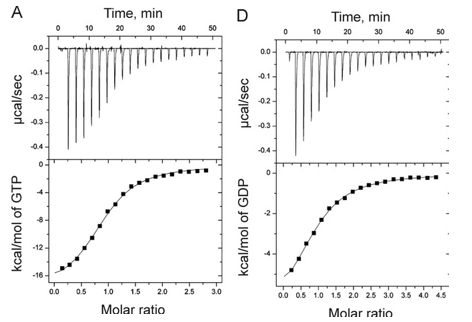
a. The titration curves above appear sigmoidal in contrast to the hyperbolic saturation binding curve you drew for a simple M + L binding equilibrium. Sigmoidal ML vs L binding plots are often associated with cooperative binding interactions. Why are these plots NOT hyperbolic even they the enthalpy changes can be best modeled by a simple, non-cooperative binding of M and L with a stoichiometry of 1?
Answer: The bottom plots above shown signal change (enthalpy change) as a function of molar ratio, NOT free ligand. Using the Kd derived from the theoretical fit, and the actual total concentrations of SelB and GXP, the amount of ML and free GXP could be calculated. A plot of enthalpy change vs free GXP would be hyperbolic.
b. Is the binding exothermic or endothermic? What is the sign of DH?
Answer: exothermic; negative
b. Which one proceeds with a lower dissociation constant (Kd)?
Answer: The binding of GTP since at a 1:1 molar ratio of SelB and GTP, the signal (enthalpy) change is half its maximal change, indicating a high concentration of SelB:GTP complex than see in B.
c. Assuming that the binding is favored, which one has a more negative DG0? Assume equal concentrations of SelB in the sample cell. Which one is more favored under standard condition?
Answer: The binding of GTP as the higher the Keq, the lower the Kd, the more negative the DG0.
d. The change in Gibbs Free energy is also related to the change in enthalpy and entropy as shown in the equation below:
Can you deduce from simple inspection of the curves above if DS0 is <, =, or >? Explain.
Answer: Since binding occurs under the experimental conditions, lets assume Keq > 1 and Kd < 1 (although this might not be true if the concentrations of SelB and GXP were suffiiciently high enough in the experiment to overcome a Keq < 1). Hence DG0 <0. Since binding is exothermic, DH0 < 0. That implies that -TDS0 could either be negative (so DS0 is positive) or that TDS0 is positive (so DS0 is negative) but not positive enough to make the reaction disfavored.
The ITC thermograms comparing the binding of GTP (A) and two analogs of GTP, GTPγS (B), GDPNP (C), are shown below
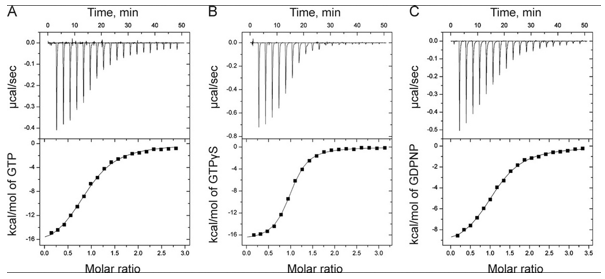
d. Again assuming similar concentration of SelB in the sample C, compare the Kds for the interaction of GTPγS and GDPN to SelB.
Answer: The reaction of GTPγS has progressed to a greater degree at a 1:1 stoichiometery than that of GDPN to SelB. Hence GTPγS has a lower Kd for binding SelB.
e. The structures of GTP and the two analogs are shown below. Suggests a reason that the investigators used the analogs in their studies.
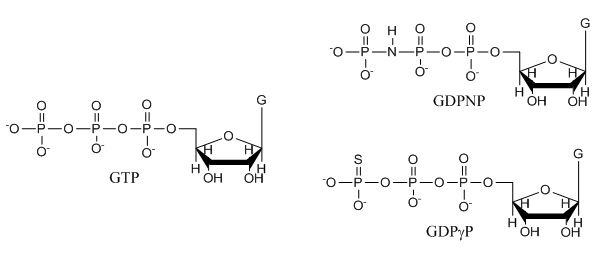
Answer: These are likely to undergo hydrolysis at the gamma P which is import as they study a protein that can bind either GTP or GDP and that has GTPase activity. The S in the GTPγS analog is less electronegative than O and hence less likely to pull pi bonded electrons in the double bond toward in the developing transition state to form an oxyanion pentavalent intermediate. Likewise, the P-N bond in the other analog is less likely to be cleaved as the leaving group with a negative charge on the less electronegative N is less stable.
f. The ITC thermograms be fit to a theoretical model for M and L binding with a stoichiometry of one. From this data fit, Kd can be determined. How would you calculate the DS0 for the interaction of SelB and GXP?
Answer: If you know Kd, you can determine DG0 since it equals -RTlnKeq = RTlnKd. You can determine DH0 directly from the experiment. Hence you can obtain DS0 from the equation DG0 = DH0 -TDS0 .
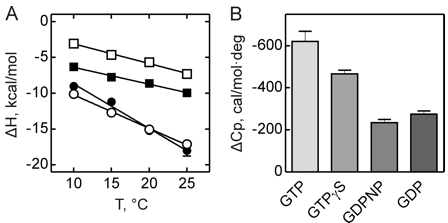
The thermodynamic parameters of SelB binding to guanine nucleotides at different temperatures are shown below.
g. Do they confirm your answers to b and d above?
Yes
2. To determine the effect of change in protonation state on binding of SelB and GXP, the effect of different buffer solutions on the binding enthalpy of SelB-GTP was studied.
Figure A below shows binding enthalpy of GTP to SelB in phosphate buffer (●), HEPES buffer (○), and Tris buffer (■) as a function of temperature.
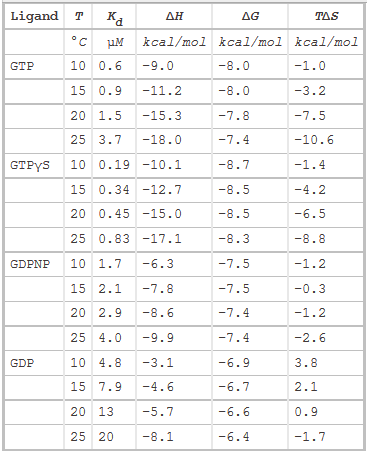
a. Any change in enthalpy accompanying proton release or uptake on binding of a macromolecule to a ligand would be affected by the change in enthalpy on binding of protons to the buffer base. To investigate the effect of buffer ionization enthalpy, the Each of the buffers has a different DHion which is the enthalpy change on ionization of a proton from the buffer acid. State two facts that characterize the graphs.
Answer: Here are two - the graphs are all parallel and the DH of binding of SelB and GXP depends on the temperature
b. Figure B above shows the dependence of binding enthalpy of SelB-GTP interaction (y axis) on the buffer proton-ionization enthalpy at 10 �C (●), 15 �C (○), 20 �C (■), and 25 �C (□) for 4 different buffers whose enthalpy of ionization are known at different temperature (x axis). What are the units for the slope of the line? What is the actual slope? What does this tell you? What does the y intercept tell you? Why use is the y intercept in this study?
Answer: Unitless. The slope of the plot yields the net number of protons coupled to the binding reaction, 0.2–0.3 for the three buffers used, and the Y-intercept yields the biochemical binding enthalpy change at the given temperature, ΔH�. The latter represents the true heat released upon complex formation when the complex formation is not affected by buffer ionization heat because the intercept gives the heat value for the reaction in a hypothetical buffer with the proton ionization heat equal to 0. This is what the investigators wanted: the enthalpy change associated with binding of SelB and GTP with no contributions to changes in protonation of the buffer solution components.
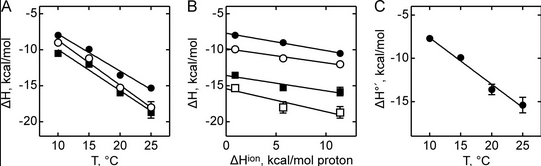
Figure C above shows the enthalpy change for binding of SelB and GTP corrected for buffer solution protonation changes. Standard deviations of measurements are given by error bars (in some cases not visible because they are smaller than symbol size) Note that the DH is a linear function of temperature. The slope of the line has units of kcal/mol/oC which is heat capacity. The change in heat capacity, DCp = dDH/dT can give us insight into the nature of the binding interactions. To understand this, first consider change in thermodynamic parameter when benzene is transferred from pure benzene to water. A graph showing thermodynamic properties as a function of temperature for this transfer reaction is shown below.
c. Is the positive value of DG for transfer of benzene from pure benzene to water in accord with your understanding of physical and chemical properties of benzene? Explain.
Answer: Yes. Benzene is nonpolar and as such is very insoluble in water. Hence the free energy changes for that process should be positive.
d. At first glance you might expect that the collective benzene-benzene IMFs and H2O-H2O IMFS might be stronger than benzene-H2O IMFs and hence the dissolution of benzene in water might require an input of heat energy to drive it so the process would be endothermic. Yet around 275K it is a bit favored enthalpically to for benzene to dissolve in water. What dramatically disfavors it is entropy. This is manifestation of the hydrophobic effect which helps drive protein folding so that hydrophobic side chains are buried.
A key signature of the hydrophobic effect is that the transfer of nonpolar groups to water is associated with a positive DCp. Note that taking benzene from benzene is water is characterized by a linearly increasing DH with increasing temperature and hence a positive DCp. We will use this idea to analyze the DCp for SelB and GTP binding. For graph C above, what is the sign of DCp? What molecular interpretation can you give to that value?
Answer: The binding of SelB and GTP proceeds with a negative DCp as the DH becomes more negative with increasing temperature. This implies that the binding of SelB and GTP is accompanied by a net burial of hydrophobic groups.
3. The main source of DCp changes on binding arise from loss of water of interacting water from the surfaces of protein and ligand on binding, with the main contribution arising from the hydrophoboic effect. Another less sizeable contribution to DCp would arise from burying polar residues with the ensuing changes in bound and bulk water interaction potentials. The following equation has been used to show the contribution to ΔCp from dissolution of solids compounds in water:
ΔCp = DcapDASAap + DcpDASAp,
where DASAap and DASAp are the apolar and polar solvent accessible surface areas changes, respectively. Model compounds give values of Dcap = 0.45 and Dcp= -0.26 per mol of SA (angstroms squared).
Table 2 below shows heat capacity changes and accessible surface area for SelB binding to guanine nucleotides. ΔCp, heat capacity change; obtained as ΔH/dT; ΔASAap and ΔASAp, changes in apolar and polar solvent-accessible surface areas assuming that all the changes were conferred by either apolar (AAap) or polar (AAp) residues, respectively with no contribution from the other. (Ex: for GTP in Hepes, 621/0.45=1380) The values for the buried area were converted into the numbers of amino acids that were removed from the surface using the average ASA for apolar (34 �2) and polar (56 �2) amino acids.
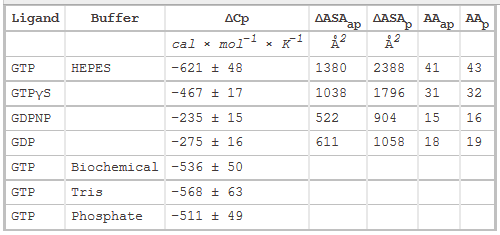
Figure 3 shows the heat capacity changes upon SelB interaction with guanine nucleotides. A, temperature dependence of binding enthalpy changes upon SelB interactions with GTP (●), GTPγS (○), GDPNP (■), and GDP (□). Standard deviations of measurements are given by error bars, which are smaller than the symbol size. B, bar representation of heat capacity changes upon SelB interactions with guanine nucleotides.
From graphs A and B and Table 2 above, compare the similarities and differences between the free and bound states of SelB with the different ligands.
Answer: GTP binding to SelB caused a large change in heat capacity, suggesting a major structural rearrangement corresponding to 41–43 amino acids that altered their contacts upon binding. With GTPγS, the conformational changes were somewhat smaller, indicating that 31–32 amino acids were affected by complex formation. The smallest changes were observed with GDP and GDPNP with 15–19 amino acids that changed their interaction partners upon interaction with SelB. The ITC measurements indicate that the structures of the GTP- and GDP-bound forms of SelB are different and that about 25 amino acids rearrange during the GTP-GDP conformational switch. Although it is usually assumed that all nonhydrolyzable GTP analogs can readily substitute for GTP, our findings suggest that a careful analysis of different GTP analogs is required to find the one that resembles the natural substrate most closely. The affinity of SelB for GDPNP is only two times lower than for GTP, but the values of both enthalpy and entropy changes resembled more those of GDP binding. Furthermore, SelB�GDPNP has a 10-fold lower affinity for Sec-tRNASec when compared with SelB�GTP, supporting the notion that GDPNP is not an authentic GTP analog for SelB. On the other hand, binding of GTPγS to SelB is surprisingly tight with aKd value 3–4 times smaller than that of SelB�GTP. Because other thermodynamic parameters are comparable for GTPγS and GTP complexes of SelB, we conclude that GTPγS is a better GTP analog for SelB than GDPNP. The general implication of these findings is that nonhydrolyzable GTP analogs are not in all cases faithful replacements for GTP, and thus, results obtained with the help of these analogs, including crystal structures, have to be interpreted with caution.
4. To further study the differences in SelB conformations upon binding of GTP, GDP, and nonhydrolyzable analogs, SelB and its complexes were separated by size-exclusion chromatography which separates on hydrodynamic volume (with larger molecules of the same shape eluting first). Figure 4 below shows the separation of apo form and nucleotide-bound forms of SelB by size-exclusion chromatography. Elution profiles of SelB�GTP (——), SelB�GTPγS (– – –), SelB�GDP (����), SelB�GDPNP (�–�–�–), and SelB (��–��–��–) were monitored by intrinsic tryptophan fluorescence (λexcitation = 280 nm, λemission = 355 nm). a. u., arbitrary units. Are these results consistent with the ITC results? Is the order of elution expect based on the results?
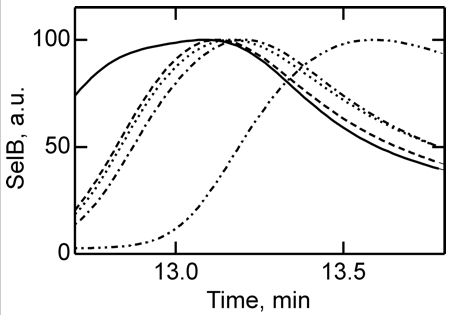
Answer: The apparent hydrodynamic radii of SelB in apo form and nucleotide-bound forms were significantly different, providing a clear separation of all five forms of SelB (Fig. 4). The order of elution follows the magnitude of conformational changes in SelB that were derived from the ITC data, with the complexes eluting in the order SelB�GTP, SelB�GTPγS, SelB�GDP, SelB�GDPNP, and SelB-apo. The differences between the GTP, GDP, and apo forms are particularly clear.
Note however, that the order of elution is not what was expected. If SelB:GTP had the largest negative ΔCp, and this is associated with the largest changes in surface area of the protein, you would expect that the SelB:GTP complex might have the smallest hydrodynamic radius and elute last from the column, not first. In lieu of crystal structures, which might shown a nonspherical shape that might justify the order of elution noted, we have to be satisfied that the separation did correlate with the experimental ΔCp values.
Summary
5. The binding interactions between SelB and GTP are enthalpically favored and entropically disfavored and proceed with a negative - DCp.
a. List possible factors (not including buffer solution DHion) that could lead to enthalpy changes on binding
Answer: Enthalpy change accompany making and breaking IMFs among atoms in both species. These would include:
b. List possible factors (not including buffer solution DHion that could lead to enthalpy changes on binding
Answer:
c. List possible factors that could lead to heat capacity changes on binding
net decrease in hydrophobic groups exposure to water on complex formation (- DCp)
net removal of surface area of the protein from contact with solvent (- ΔCp)
any process in which water is released from the surface (- ΔCp), including conformational changes in the protein which reduce the hydrodynamic radius and hence surface area of the protein on complex formation.
6. Briefly summarize the main findings that clarify RelB function in a cell.
Answer: The data indicate that SelB can adopt three discrete conformations that are clearly distinct from each other: the apo form, which is the most open form of the protein, the closed GTP-bound form; and the GDP-bound form, which is the intermediate between the apo form and the GTP-bound form. Given the high concentration of GTP in the cell and the high rate of nucleotide binding to SelB, the apo form is most probably short lived and therefore unlikely to play a functional role, whereas the transition between the GTP to GDP form is essential for the function of SelB on the ribosome. ITC analysis suggests that the GTP- and GDP-bound forms of SelB are different and that the factor is likely to follow the functional and structural cycle typical for many other GTPases