Determination of Mechanism in Chemistry
Detection of Intermediates
MK10. Using Kinetics to Map the Potential Energy Surface
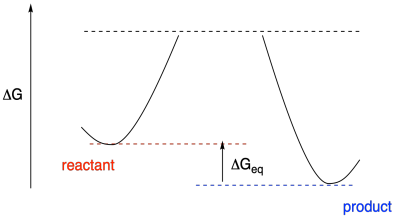
How would we put together an accurate potential energy diagram, complete with realistic energy values? In principle, we just have to measure an equilibrium constant to determine the relative energy of reactants and products. The equilibrium constant depends on the energy difference between reactants and products. If we can determine the equilibrium constant, we can determine the free energy difference, using the relationship ΔG = - RTlnKeq.
Figure MK10.1. A reaction progress diagram with information about thermodynamics but not kinetics.
Problem MK10.1.
Calculate the free energies of reaction from the following equilibrium constants:
a) K = 0.93 at 35 °C b) K = 7.6 at 50 °C c) K = 3.8 at 70°C
Remember, R = 1.987 cal K-1mol-1 (or 8.314 J K-1mol-1).
That information tells us about the depths of the valleys where we find the reactants and products. What about the mountains? Well, that information comes from kinetics. If we can measure rate constants, we can extract activation energies from them, using ΔG‡ = RTln(kBT/h) - RTlnk.
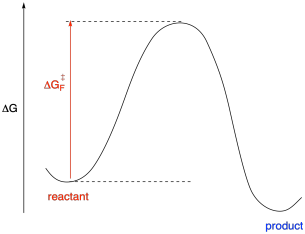
Figure MK10.2. A reaction progress diagram with kinetic and thermodynamic information.
Problem MK10.2.
Calculate the free energies of activation from the following rate constants.
a) k = 3.7 x 10⁻⁵ s-1 at 45 °C b) k = 1.9 x 10⁻⁶ s-1 at 65 °C c) k = 4.8 x 10⁻⁷ s-1 at 85 °C
Remember, h = 6.626 x 10⁻³⁴ J.s-1; kB = 1.38 x 10⁻²³ J K-1.
Of course, if we are able to measure the equilibrium, it's possible that we may also be able to obtain the product and drive it backwards. We may be able to measure the rate of the reverse step and figure out the activation energy of that reverse step. Even if we can't, we could deduce it using the information already at hand. After all, both forward and reverse reactions go through the same transition state. We can calculate the activation energy of the reverse reaction by combining the energy of the reaction and the activation barrier for the forward step.
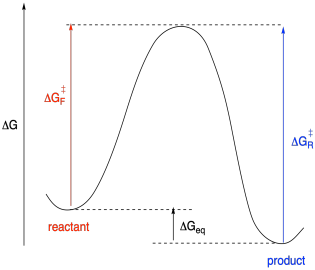
Figure MK10.3. A reaction progress diagram with information about both the forward and reverse barrier.
What if the forward and reverse reactions do not go through the same transition state? What if there is an intermediate in the reaction? In that case, there would be two separate transition states, coming before and after the intermediate. That leads to one more variable quantity, the difference in energies between these two transition states.
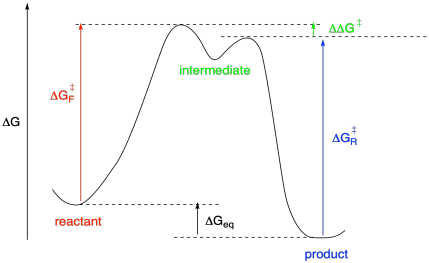
Figure MK10.4. A reaction progress diagram with an intermediate.
Problem MK10.3.
Determine the missing piece of information in each case.
a) ΔG‡f = 21.3 kcal/mol; ΔGrxn = -1.4 kcal/mol; ΔG‡r = ?
b) ΔG‡f = 27.5 kcal/mol; ΔGrxn = -6.2 kcal/mol; ΔG‡r = 30.3 kcal/mol; ΔΔG‡ = ?
c) ΔG‡f = 29.4 kcal/mol; ΔG‡r = 31.7 kcal/mol; ΔΔG‡ (for - rev) = 0.8 kcal/mol; ΔGrxn = ?
We can't measure the height of that second barrier by measuring the rate of the back-reaction going from product all the way to the reactant side. That would simply tell us the height from the product valley all the way to the peak between reactant and intermediate. That's the bottleneck, the highest barrier that reaction must surmount, so its energy would be reflected in the kinetics of the back-reaction. For that reason, the height of that second barrier needs to be measured in a different way.
Instead, it may be possible to measure the difference in activation barriers leading from the intermediate towards the two possible products that the intermediate could form. Here, we've switched from referring to one side of the graph as the reactant, because we are currently thinking of the intermediate as a reactant that can form either of two products. The idea is to generate the intermediate from some other precursor and then monitor the amount of the two possible products at very early conversion. By early conversion, we are talking about only a small percentage of precursor being turned into those products. By looking at this product ratio at early conversion we see results that are dependent only on the kinetics of the reaction from intermediate to product. Presumably there has been no time for back-reaction from the products to the intermediate, and no equilibrium has been extablished, so the product ratio reflect only the forward reaction from intermediate.
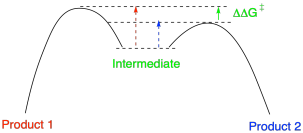
Figure MK10.5. The barriers leading from the intermediate to product or reactant.
This site was written by Chris P. Schaller, Ph.D., retired, College of Saint Benedict / Saint John's University (with contributions from other authors as noted). It is freely available for educational use.

Structure & Reactivity in Organic, Biological and Inorganic Chemistry by Chris Schaller is licensed under a Creative Commons Attribution-NonCommercial 3.0 Unported License.
Navigation:
Back to Determination of Mechanism