Determination of Mechanism in Chemistry
Mathematical Tools in Kinetics
MK15. Reaction Progress Kinetics
Instrumental design has progressed to the point that we can obtain spectroscopic data much more quickly than we could a generation ago. That technological revolution has had a tremendous impact on the study of kinetics. For example, stopped-flow techniques allow reagents to be mixed rapidly together in a spectrometer and the reaction monitored immediately, allowing a glimpse into processes that previously might have been over before the first data point could be obtained.
Furthermore, we can now rapidly acquire an enormous number of data points throughout the course of a reaction. That development has given rise to a method called reaction progress kinetics, developed chiefly by Prof. Donna Blackmond at Scripps Research Institute. The amount of information in one data run now allows us to gain reliable information that previously would have required a series of time-consuming experiments.
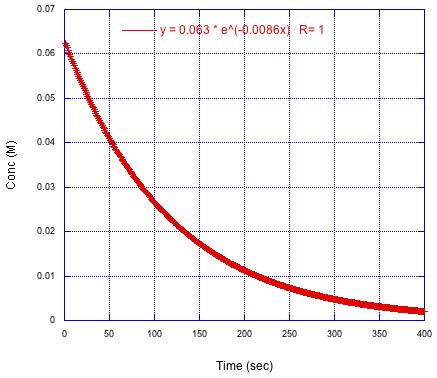
Consider the following (simulated) experiment. The results of some spectroscopic measurement have been plotted against time, so we can see the rapid decrease in the concentration of starting material over several minutes. The data has been fit to an exponential decay. The parameter in the exponent corresponds to the observed rate constant.
Figure MK15.1. Plot of reactant concentration versus time.
The key insight from reaction progress kinetics is that we already have data here that provides us with additional variables that we might be interested in plotting and analysing. If we have a curve that relates concentration to time, then we also have access to the derivative of that curve. The derivative, d[Conc]/dt, is the reaction rate. So, just by extracting some additional information from this curve, we could also plot the reaction rate vs. time or, perhaps more importantly, reaction rate vs. concentration.
Problem MK15.1.
From the curve shown above, estimate the slope of the line at
a) concentration = 0.055 M b) concentration = 0.005 M
Here is that information. It looks a lot like the previous curve because the derivative of an exponential is just another exponential with a different coefficient. In this case, the plot actually shows the absolute value of the derivative; the rate is really a negative number, but that just means the concentration is decrasing rather than increasing.
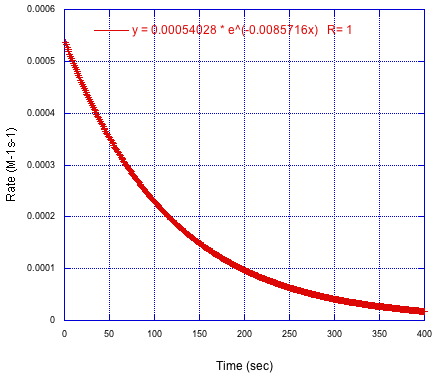
Figure MK15.2. Plot of reaction rate versus time.
Problem MK15.2.
Determine the derivatives of the following expressions.
a) y = 2e-3x b) y = 0.6e5x
If we want to obtain the derivative of the concentration vs. time curve, it's actually more common practice to fit the data to a polynomial rather than to an exponential. The exponential related back to what we understand about kinetics, but the polynomial is very easy to work with if we want to take a derivative. Usually researchers will use an 8th or 9th order polynomial to get the best fit. The simulation below just shows a sixth-order polynomial.
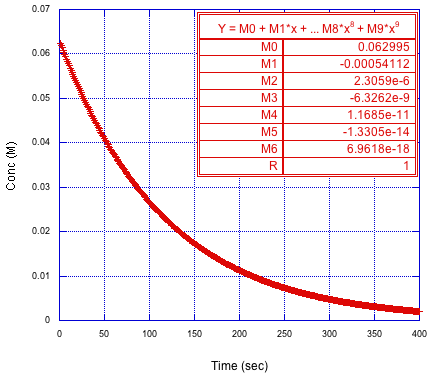
Figure MK15.3. Polynomial fit to the reactant concentration versus time curve.
Here's the derivative again. This time it's obtained from the polynomial. If plotted against time, it looks just like the rate vs. time curve shown above, but that's not the most interesting part of the results. No, the interesting thing happens when we plot the derivative vs. the initial concentrations that corresponded to those time points in that very first graph. If we do that, we get something like this:
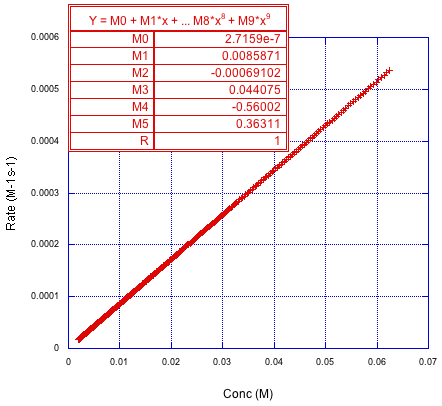
Figure MK15.4. The derivative of the polynomial fit gives rate; rate is plotted versus concentration.
Why is that interesting? It's just a straight line. Well, that's exactly what we would expect if the reaction were first order in that reactant. We were able to get that information from a single experiment rather than from three or four of them.
Problem MK15.2.
Determine the derivatives of the following expressions.
a) y = 0.3 + 3x - 2x2 b) y = 7 + 0.9x - 5x2 + 8x3
Now let's look at a different case in which the initial fit to an exponential decay didn't work as well. We can clearly see the fitted line here. It's doesn't overlap very closely with the data points. This reaction doesn't see to be a simple first-order one. What's going on?
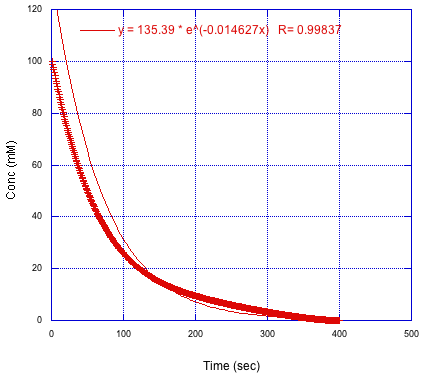
Figure MK15.5. A plot of concentration versus time that does not fit exponential decay.
Even without knowing anything about the kinetics of the reaction, we can always fit to a polynomial. The underlying chemistry doesn't matter; we're just modeling the numbers.
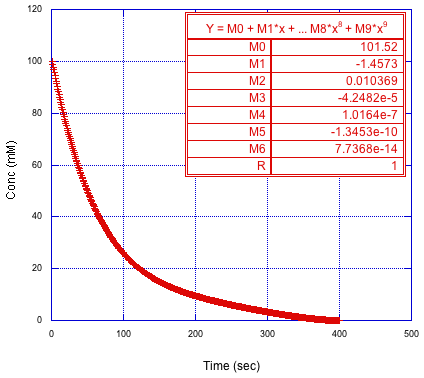
Figure MK15.6. Polynomial fit to concentration versus time curve.
But what happens this time if we take the derivative of that polynomial and plot the new data against our concentrations from the previous graph? We don't get the straight line we had before. It does start out pretty straight, but then we get some downward curvature.
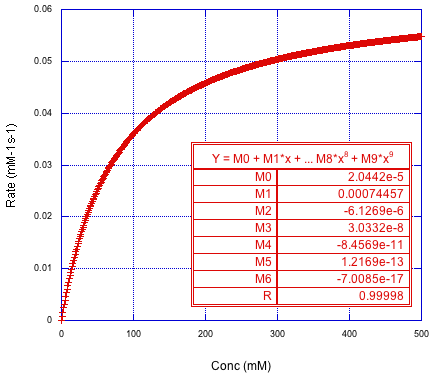
Figure MK15.7. The derivative of the polynomial plotted against concentration.
Does that remind you of anything? It looks like a saturation curve. We usually see that in the kinetics of catalysis. The reaction may start out first order, but once the catalyst becomes saturated, the rate levels off dramatically. In that case, we can fit to the form of the Michaelis-Menten equation.
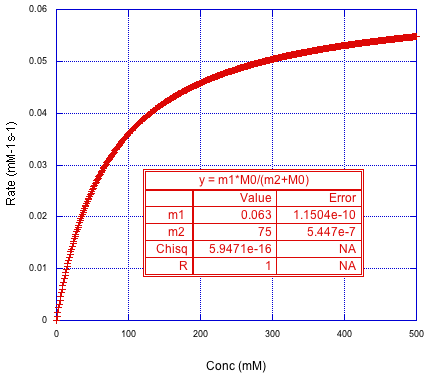
Figure MK15.8. The rate versus concentration curve fit to the Michaelis-Menten equation.
In the fit, m1 corresponds to Vmax and m2 corresponds to Km. So, we have been able to extract these fundamental parameters of a catalytic reaction from one kinetics run.
This site was written by Chris P. Schaller, Ph.D., retired, College of Saint Benedict / Saint John's University (with contributions from other authors as noted). It is freely available for educational use.

Structure & Reactivity in Organic, Biological and Inorganic Chemistry
by Chris Schaller
is licensed under a Creative Commons Attribution-NonCommercial 3.0 Unported License.
Navigation: