
Determination of Mechanism in Chemistry
Detection of Intermediates
MK9. Potential Energy Surfaces
Potential energy surfaces are useful tools that allow us to convey ideas about structure and energy over the course of the reaction. Like most symbolic tools, they also influence how we think about reactions.
To take an example that is probably familiar, let's look at the 1,2-elimination of HX across a carbon-carbon bond to form an alkene. X in these cases is usually a halogen, but it could be another good leaving group such as a sulfonate or pyrophosphate.
Figure MK9.1. A 1,2-elimination reaction.
We begin by thinking about bond-making and bond-breaking steps in this reaction. The overall energy change of a reaction is usually related to the difference between bond-breaking, which costs energy, and bond-making, which releases energy. However, there can be other factors beyond bond strengths, especially the stabilization of particular ions. In this case, that would involve bases and leaving groups.
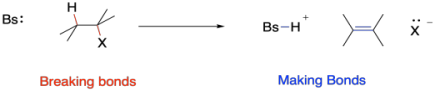
Figure MK9.2. Bond-making and -breaking in a 1,2-elimination reaction.
Most of the time, bond-breaking begins to occur early in a reaction; that's certainly true in eliminations from alkyl halides. There are two bonds that need to break in this case: the C-X at position alpha and the C-H beta to it. The order in which those events occurs determines the mechanism of the reaction. In one possibility, the C-X bond breaks first, forming a carbocationic intermediate. The base removes the beta proton in the next step.

Figure MK9.3. An E1 mechanism for a 1,2-elimination reaction.
That first step is purely bond-breaking and it costs a significant investment of energy. It's the rate determining step. In contrast, during the second step there is energetic payback in the form of the new bond between the base and the proton to partially offset breaking the C-H bond. We would draw a reaction progress like the one below, summarizing these energetic considerations.

Figure MK9.4. A reaction progress diagram for an E1 reaction.
Problem MK9.1.
In an E2 mechanism, the reaction proceeds in one step. Provide a reaction progress diagram for this mechanism.
Problem MK9.2.
Although less common than the other two mechanisms, a mechanism exists in which the base removes the proton in the first step. This mechanism is described as E1CB. Provide a reaction progress diagram for this mechanism.
The heights of the barriers in that E1 reaction progress diagram can be difficult to assess. Those energy levels depend on the relative stabilites of the transition states in each step. We know they are higher in energy than either the reactants or the products, but how high, exactly?
Wait a minute, some students will say. Why are we talking about transition states for an E1 reaction? An E1 reaction has an intermediate - that carbocation - and not a transition state. Transition states happen in concerted reactions, like an E2 reaction.

Figure MK9.5. A reaction progress diagram for an E2 reaction.
Well, no. Only some reactions have intermediates. All reactions have transition states. The transition state is just the structure at the height of the energy barrier. As in the E2 transition state, the E1 would have transition state structures in which bonds are in the midst of breaking or forming. Because an E1 reaction happens in two steps, it has two barriers, and therefore two transition states. The C-X bond is lengthening in the first transition state, whereas the C-H bond is lengthening in the second.

Figure MK9.6. A reaction progress diagram for an E1 reaction including its two transition states.
Problem MK9.3.
Show the transition states on the reaction progress diagram for the E1CB reaction.
Reaction progress diagrams are sometimes compared to mountain ranges. The path that the reactants take to get over the mountains, which is the lowest available pathway in terms of energy, is shown in these diagrams. Sometimes there is an alpine valley in the middle where the reactants, now promoted to the role of intermediates, can rest for a while before proceeding onward. These diagrams really just show a cross-sectional slice through these mountain ranges, though, so we lose a lot of information about the energetics of the system.
A three-dimensional diorama of the mountains would reveal a lot more information. If we are working on a computer screen or in a book, three dimensions might be challenging to convey, but mapmakers have found ways around that challenge for a very long time. They use countour maps to show the mountains from above, with contour lines to convey the idea of relative elevation. The same approach can be taking in conveying information about the energetics of reactions, such as in this diagram of a potential energy surface for an elimination reaction, below. This particular example is just a cartoon but it gives you the idea of the kind of information conveyed in such a plot.
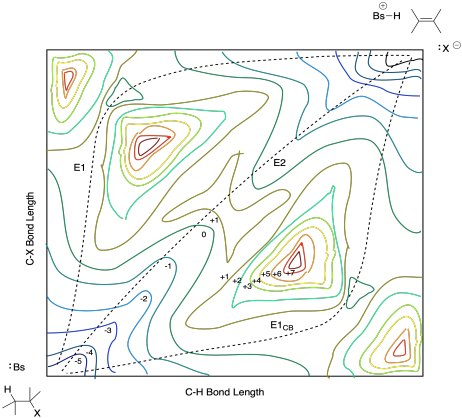
Figure MK9.7. A potential energy surface for a 1,2-elimination reaction.
The diagram shows C-X bond length along one axis and C-H bond length along another. Tracing along either axis, we can see what happens to energy as well change that bond length; the energy is illustrated using contour lines. Note that all three mechanisms are shown on one plot, illustrating the possible pathways the reactants could take on their way to the products.
A diagram like this one describes the potential energy surface of the reaction. The potential energy surface is much like the surface of the earth laid out before us as we look across a mountain valley. If we walk down into the valley, we lose potential energy. If we climb up the other side, we gain potential energy. However, to make that climb, we need to expend some energy (maybe we will eat a granola bar). Molecules need energy to climb these heights as well, usually in the form of thermal energy or heat from their surroundings.
The contours of the diagram can change depending on the conditions. Those conditions in this case might include factors such as the reactant and base structure. For example the E1CB mechanism isn't accessible unless the anionic intermediate is stabilized by a neighbouring electron-withdrawing group such as a carbonyl. In that case, the carbonyl stabilizes the anion in the alpha position via resonance delocalization. The intermediate is relatively low in energy, and so the path through that intermediate is also relatively low in energy. That feature would lead to a diagram more like the one below:
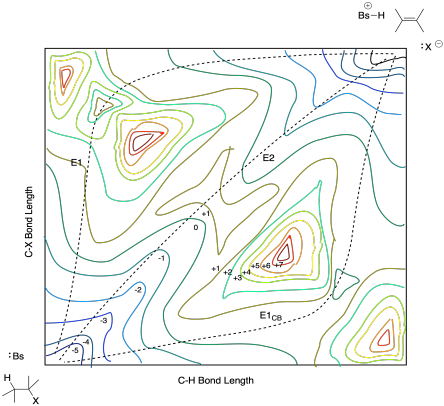
Figure MK9.8. A potential energy surface with a lower barrier to C-H breaking than C-X breaking.
In most cases, however, the anionic intermediate that would result during an E1CB mechanism is quite high in energy. It just isn't accessible without the stabilized influence of a carbonyl or other resonance electron-withdrawing group. More often, the intermediate is relatively high in energy. That problem would make the surface rise in the area of that anionic intermediate, so the diagram would look more like the one below:
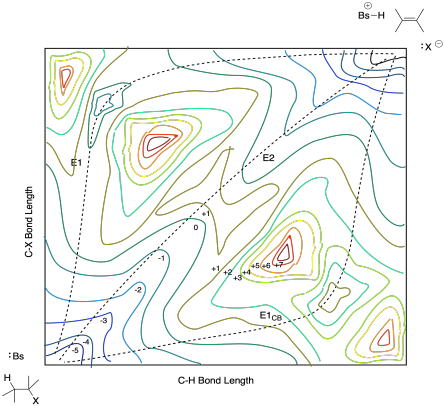
Figure MK9.9. A potential energy surface with a lower barrier to C-X breaking than C-H breaking.
In a similar way, if there are no structural features that stabilize a carbocation, then the cationic intermediate along the E1 pathway will be relatively high in energy. If the cation is not tertiary, for instance, or it lacks resonance stabilization, then it may be a higher-energy intermediate. Consequently, the surface around that intermediate is also too high in energy for the molecules to traverse. The diagram looks like this one:

Figure MK9.10. A potential energy surface with significant barriers to both C-H and C-X breaking.
In that case, we can see that the E2 pathway results by default.
Problem MK9.4.
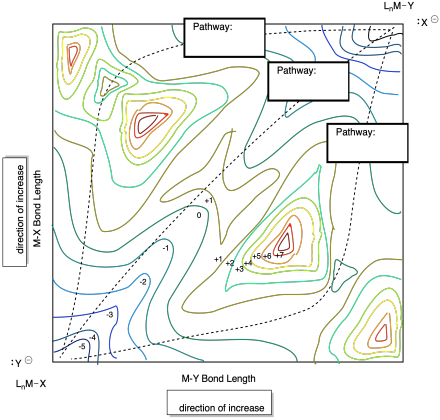
The surface below shows multiple pathways for a nucleophilic aliphatic substitution reaction. Label each pathway with the description of the mechanism.
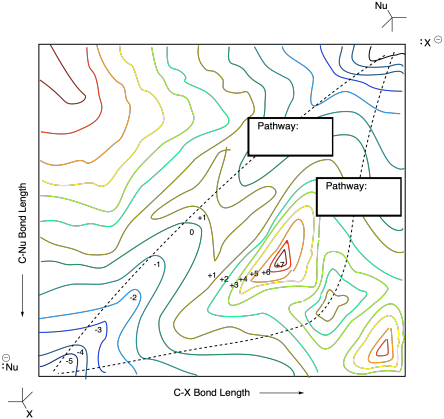
Problem MK9.5.
This site was written by Chris P. Schaller, Ph.D., retired, College of Saint Benedict / Saint John's University (with contributions from other authors as noted). It is freely available for educational use.

Structure & Reactivity in Organic, Biological and Inorganic Chemistry by Chris Schaller is licensed under a Creative Commons Attribution-NonCommercial 3.0 Unported License.
Navigation:
Back to Determination of Mechanism