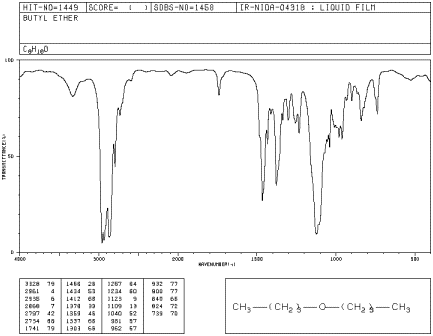
Figure IR5.1. IR spectrum of dibutyl ether.1
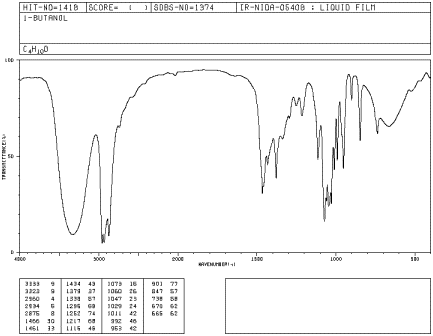
Figure IR5.2. IR spectrum of 1-butanol.1
Peak shapes are sometimes very useful in recognizing
what kind of bond is present. The rounded shape of most O-H stretching modes
occurs because of hydrogen bonding between different hydroxy groups. Because
protons are shared to varying extent with neighboring oxygens, the covalent O-H
bonds in a sample of alcohol all vibrate at slightly different frequencies and
show up at slightly different positions in the IR spectrum. Instead of seeing
one sharp peak, you see a whole lot of them all smeared out into one broad blob.
Since C-H bonds don't hydrogen bond very well, you don't see that phenomenon in
an ether, and an O-H peak is very easy to distinguish in the IR spectrum.
Problem IR5.1.
Even though there are only two C-O bonds in
dibutyl ether, the C-O stretching mode is even stronger than the peak at 2900 cm-1
arising from 10 different C-H bonds. Explain why.
Problem IR5.2.
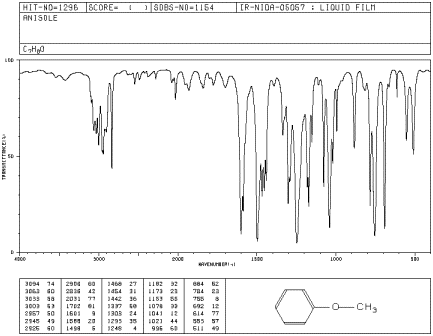
The IR spectrum of methyl phenyl ether (aka
anisole) has strong peaks at 1050 and 1250 cm-1.1

a) Identify the type of bond corresponding to these
two peaks.
b) Why are there two peaks for this type of bond in
this molecule, and not just one?
c) Draw a second, zwitterionic resonance structure for
methyl phenyl ether.
d) Use the zwitterionic resonance structure to explain
why one of these bonds shows up at a higher frequency than the other one.

Figure IR5.3. IR spectrum of methyl phenyl ether.1
1. Source: SDBSWeb : http://riodb01.ibase.aist.go.jp/sdbs/
(National Institute of Advanced Industrial Science and Technology of Japan, 14
July 2008)
Back Next
This site is written and maintained by Chris P. Schaller, Ph.D., College of Saint Benedict / Saint John's
University (with contributions from other authors as noted). It is freely
available for educational use.

Structure & Reactivity in Organic, Biological and Inorganic Chemistry by
Chris Schaller is licensed under a
Creative Commons Attribution-NonCommercial 3.0 Unported License.
Send corrections to cschaller@csbsju.edu
Navigation:
Back to Infrared Spectroscopy
Back to Structure Determination
Back to Structure & Reactivity

![]()


