Reactivity in Chemistry
Advanced Reaction Kinetics
MK7. Enzyme Kinetics: Lineweaver-Burk Plots
The Michaelis-Menten equation is useful in other ways, too. If we take its inverse, we get a new relationship.
That's useful because it's really an expression for a straight line. In general, a straight line can be described by the equation, y = mx + b, in which y is the y value, x is the x value, m is the slope of the line and b is the y intercept. If we plot 1/v against 1/[S], we get a straight line. The slope is Km/Vmax and the y intercept is 1/Vmax.
This relationship, called the Lineweaver-Burk equation, allows us to easily extract these basic kinetic quantities, Km and Vmax, from kinetic data. As we will see, it also allows us to easily distinguish different models of inhibition that look identical to each other using a Michaelis-Menten plot.
Problem MK7.1.
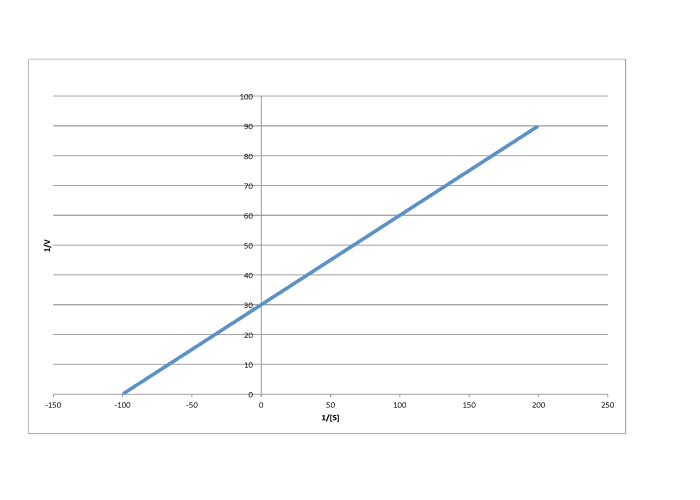
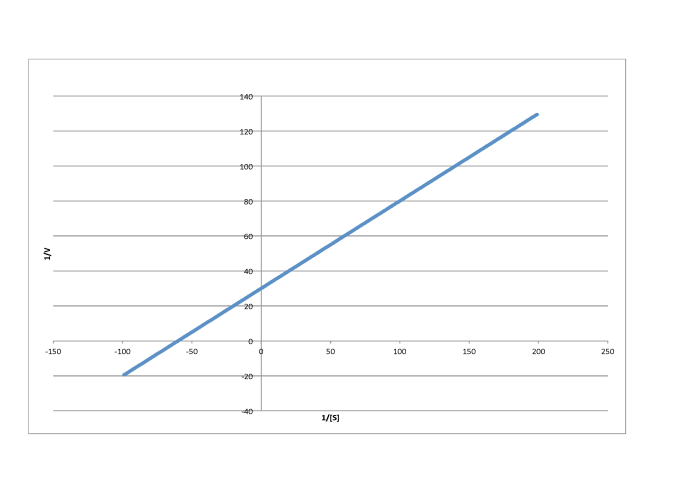
Determine the values of Vmax and Km in each of the following cases. Assume the units of [S] are millimoles per liter and the units of V are moles per liter per second.
a)
b)
c)
d)
e)
f)
Inhibition and Lineweaver-Burk Plots
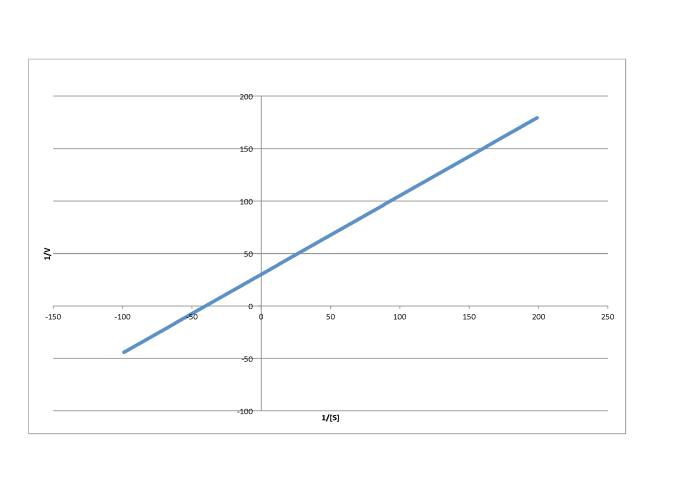
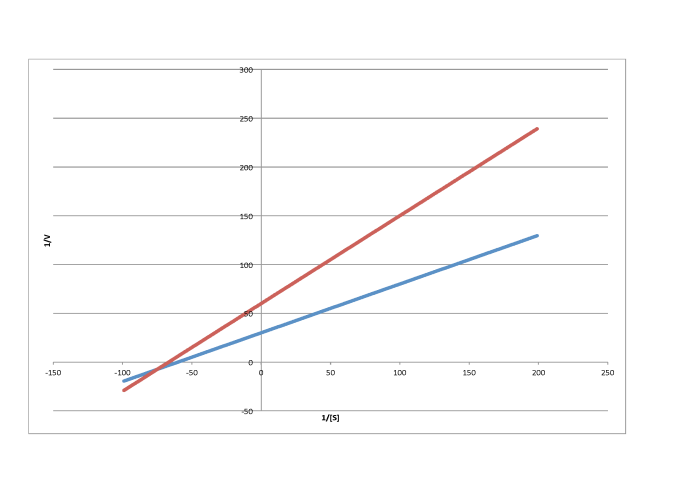
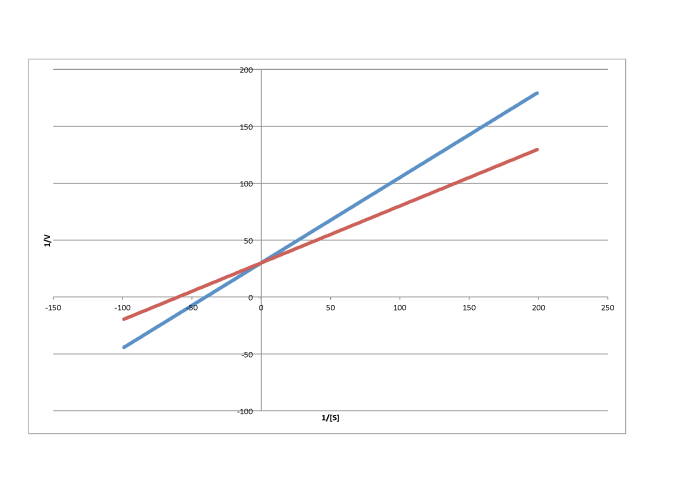
Lineweaver-Burk plots allow additional insight into the mechanism of inhibition. The following plot, for example, shows competitive inhibition.
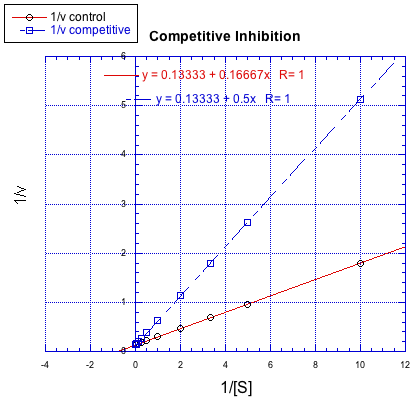
Figure MK7.1. A Lineweaver-Burk plot showing competitive inhibition.
Because the plot uses 1/v on the y axis, the slower reaction is actually the top line. The bottom line is the regular reaction without an inhibitor. Remember, the y intercept is equal to 1/Vmax. In competitive inhibition, the inhibited reaction eventually reaches (or at least approaches) the same Vmax as the uninhibited reaction. The Lineweaver-Burk plot shows both lines meet the y axis at the same place.
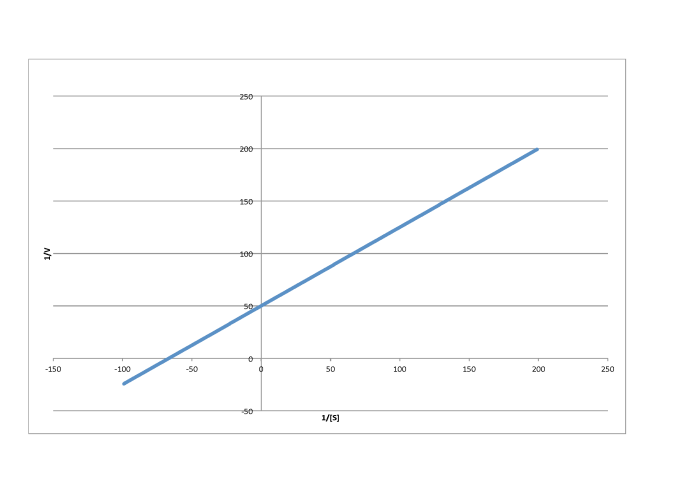
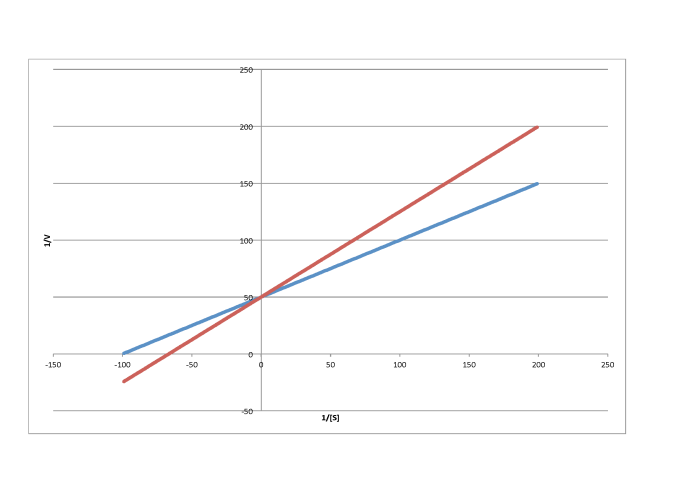
In contrast, the following plot shows noncompetitive inhibition. Once again, the regular line is the lower one, whereas the upper line is the inhibited one. The two lines do not share the same y intercept, however. However, they do share the same x intercept. That's because noncompetitive inhibition does not directly affect binding of substrate (which is reflected in Km), but interferes with the catalysis step (linked to Vmax).
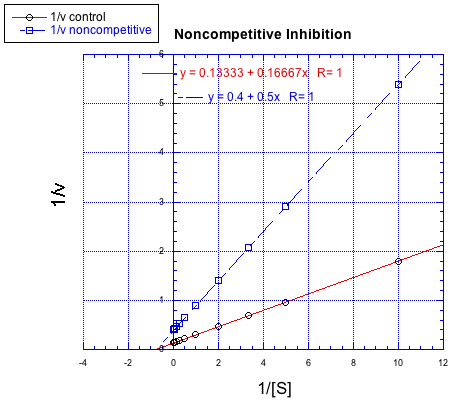
Figure MK7.2. A Lineweaver-Burk plot showing noncompetitive inhibition.
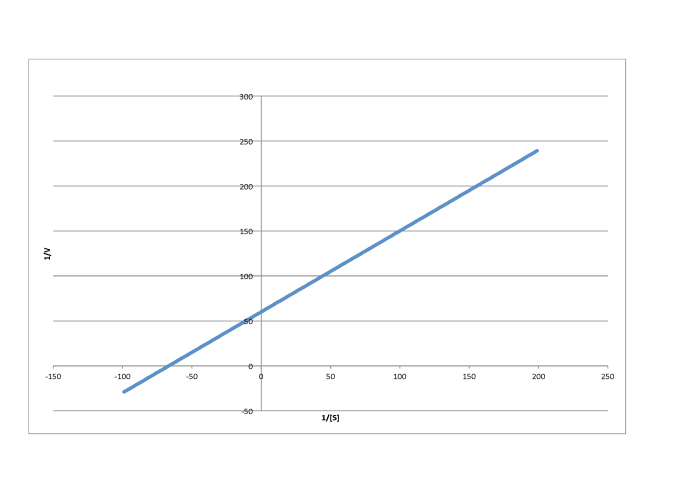
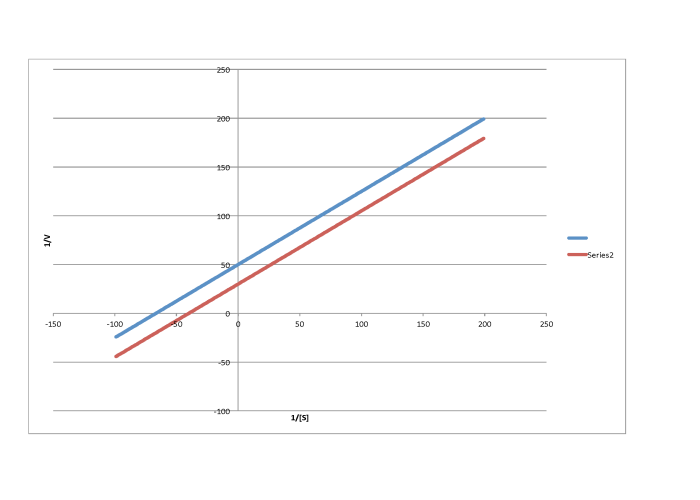
The difference between noncompetitive and uncompetitive inhibition, very subtle in a Michaelis-Menten plot, is quite clear in Lineweaver-Burk. The case illustrated below is thought of as "pure" uncompetitive inhibition. Once again, the inhibited reaction is shown by the upper line. In this case, the inhibited and uninhibited reactions produce parallel lines in the Lineweaver-Burk plot; that feature is actually the definition of uncompetitive inhibition.
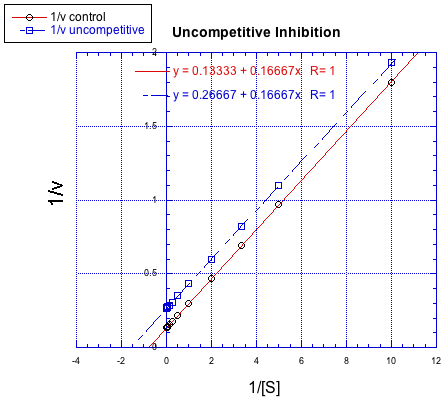
Figure MK7.3. A Lineweaver-Burk plot showing uncompetitive inhibition.
If you think about it, pure uncompetitive inhibition only happens under very specific circumstances. The Km clearly differs when an inhibitor is added; we can see that in the different x intercept. However, the slope is the same. The slope is Km/Vmax. That means that, because Km is different, Vmax must differ in exactly the same way, keeping the slope the same. For example, if Km is cut in half in the inhibited reaction, then Vmax must also be cut in half. That would keep the slope the same.
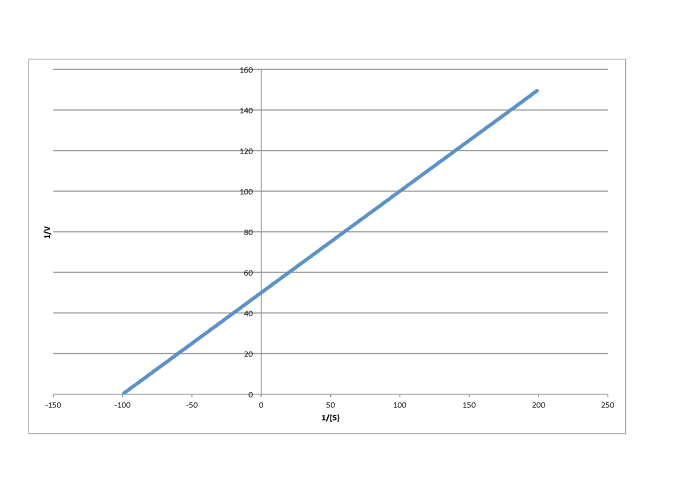
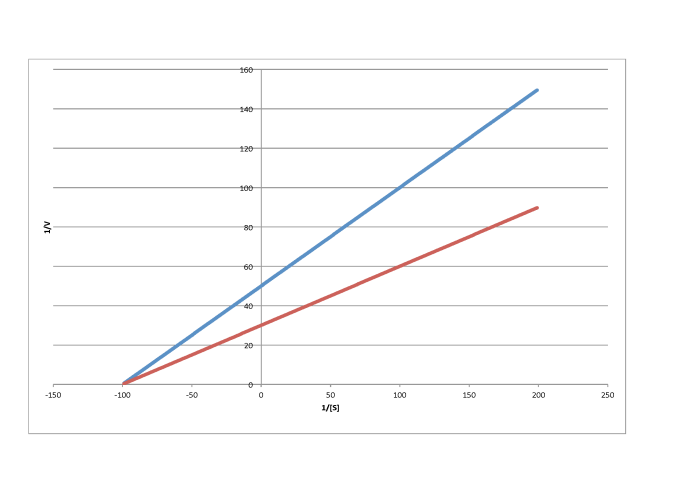
On the other hand, a situation in which the inhibited reaction does not give a line parallel to the regular reaction is called "mixed inhibition". Like uncompetitive inhibition, mixed inhibition results in changes in both Km and Vmax. However, the changes in this case do not scale exactly the same way as in uncompetitive inhibition.
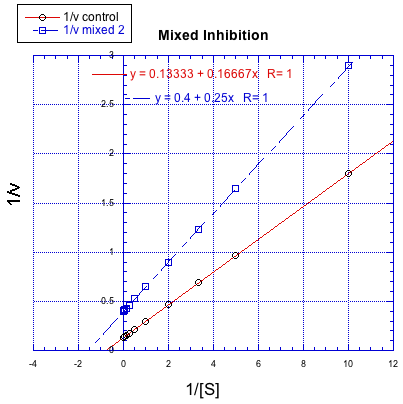
Figure MK7.4. A Lineweaver-Burk plot showing mixed inhibition.
Problem MK7.1.
Characterise each of the following graphs as representing competitive, noncompetitive, uncompetitive, or mixed inhibition.
a)
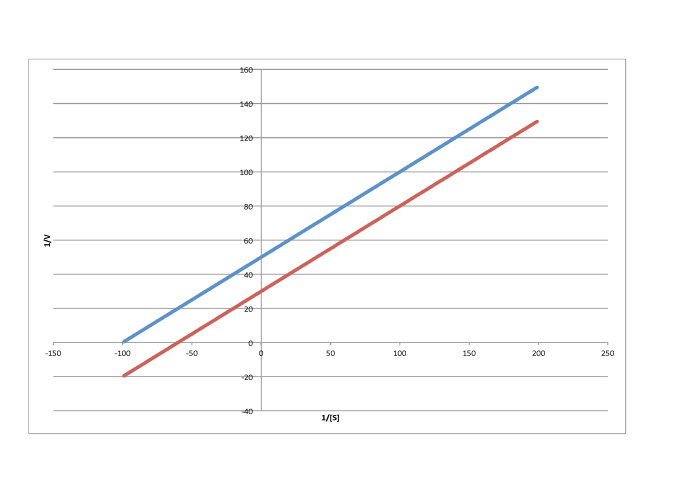
b)
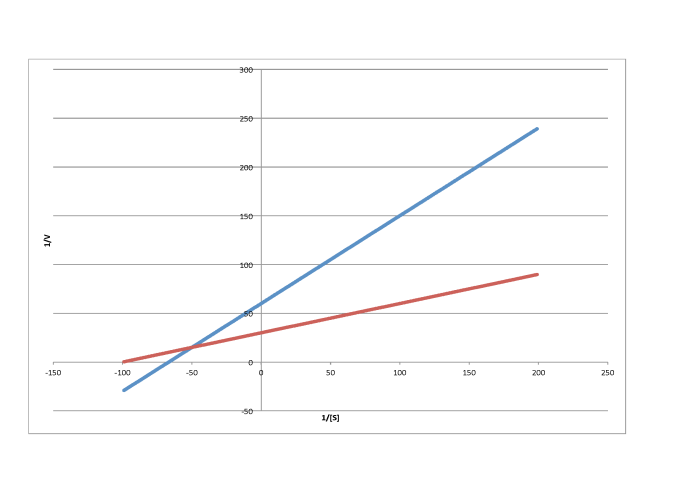
c)
d)
e)
f)
g)
This site was written by Chris P. Schaller, Ph.D., College of Saint Benedict / Saint John's University (retired) with other authors as noted on individual pages. It is freely available for educational use.

Structure & Reactivity in Organic,
Biological and Inorganic Chemistry by
Chris Schaller
is licensed under a
Creative Commons Attribution-NonCommercial 3.0 Unported License.
Send corrections to cschaller@csbsju.edu
This material is based upon work supported by the National Science Foundation under Grant No. 1043566.
Any opinions, findings, and conclusions or recommendations expressed in this material are those of the author(s) and do not necessarily reflect the views of the National Science Foundation.
Navigation: