Reactivity in Chemistry
Reaction Kinetics
RK8. Rate Laws
So far, we have talked about changes in the number of molecules over time as a reaction progresses. The number of reactant molecules decreases as the number of product molecules increases.
Practically, the easiest way to measure the speed of a reaction is to measure the concentration over time. We can measure either the concentration of the reactants or the products.
Remember, concentration refers to how densely populated a solution is with a particular compound.
Figure RK8.1. Two different concentrations of molecules.
The concentration of black dots is higher in the beaker on the right than in the beaker on the left.
Reactions are often monitored by some sort of spectroscopy. In spectroscopy, "light" or some other frequency of electromagnetic radiation shines through a sample in which a reaction is taking place. The light can interact with the molecules in the sample. The molecules absorb particular frequencies of light, so if the light encounters the molecules on its way through the sample, a little of the light at those frequencies is absorbed. Less light makes it all the way through the sample; the amount that does make it through is measured by a detector on the other side.
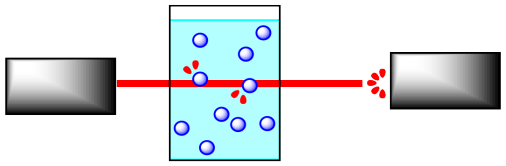
Figure RK8.2. Using a spectrometer to measure the concentration of molecules in solution.
If the concentration of the sample is different, a different amount of light from the spectrometer will be absorbed. For instance, suppose the sample is more concentrated. The more molecules there are, the more light is absorbed. And because the beam of light travels through the sample in a straight line, the more concentrated the solution, the more molecules it will encounter.
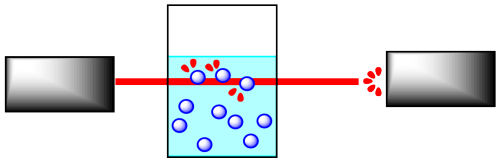
Figure RK8.3. Using a spectrometer to measure the concentration of molecules in a more concentrated solution.
It is pretty simple to calibrate the instrument to be able to determine concentration from the amount of light absorbed. In addition, the light may interact with the reactant molecules and product molecules in different ways. That means you can monitor the absorption of a frequency that you know is absorbed by reactant molecules, but not by product molecules, and you can detect changes in reactant concentration. You could also do the same thing to detect changes in product concentration.
We sometimes write the rate of the reaction as:
Rate = d[product]/dt
Meaning, the rate is the change in concentration of product with change in time.
Concentration could be measured in any units. Frequently, we are dealing with a solution, and we use units such as grams per liter or, much more commonly, moles per liter. The change in time is most often measured in seconds.
We could also write the rate of the reaction as:
Rate = -d[reactant]/dt
Meaning, the rate is the change in concentration of reactant with change in time. The minus sign just means that the reaction is getting consumed over time as it turns into product, so its concentration is decreasing.
Kinetic studies are important in understanding reactions. Not only are they important in industry, but they are also used to understand biological processes, especially enzyme-catalyzed reactions. They also play a role in environmental and atmospheric chemistry, as part of an effort to understand a variety of issues ranging from the fate of prescription pharmaceuticals in wastewater to the cascade of reactions involved in the ozone cycle.
Problem RK8.1.
Suppose the rate of the reaction between the black circles and the white circles depends only on the concentration of the black circles. That is, rate = k [black circle]. Compare the rate in each case to the rate of the reaction that would occur in the original beaker.
Problem RK8.2.
Suppose the rate of the reaction between the black circles and the white circles depends on both the concentrations of the black circles and the white circles. That is, rate = k [black circle][white circle]. Compare the rate in each case to the rate of the reaction that would occur in the original beaker.
Problem RK8.3.
Suppose the rate of a reaction in the beaker depends on the surface area of the solid at the bottom of the beaker. That is, rate = k x (surface area of white circles). Compare the rate in each case to the rate of the reaction that would occur in the original beaker.
Problem RK8.4.
Often in studying reaction kinetics, the changing concentration of a reactant or a product is plotted against time. In one method, many data points are collected very early in a reaction (when fewer than 5% of the material has reacted), and the slope of the resulting line is used to determine the "initial rate". Explain why this method might not work if the data points are plotted all the way until the reaction is finished.
Problem RK8.5.
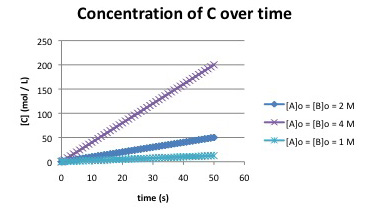
Suppose the following plots were obtained before 5% conversion for the reaction:
A + B ---> C
What do you know about the rate law for the reaction?
Problem RK8.6.
Suppose the following plots were obtained before 5% conversion for the reaction:
A + B ---> C
a) What is a possible rate law for the reaction?
b) Two different rate laws could explain this data. What is the second possible rate law?
c) Propose an experiment to distinguish between these two possible rate laws.
Problem RK8.7.
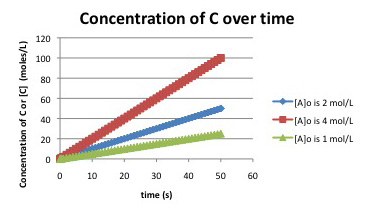
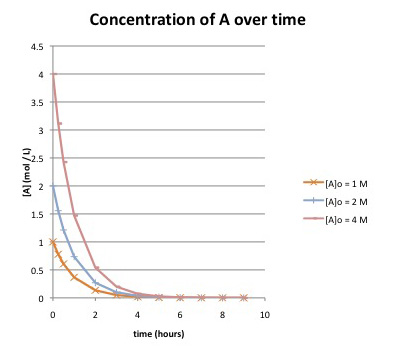
Suppose the following data were obtained by monitoring the following reaction to completion:
A + B ---> C
a) How long does it take until the reaction is essentially finished, if the starting concentration of A is:
i) 1 mol/L?
ii) 2 mol/L?
iii) 4 mol/L?
b) What do you know about the rate law for the reaction? Explain.
Problem RK8.8.
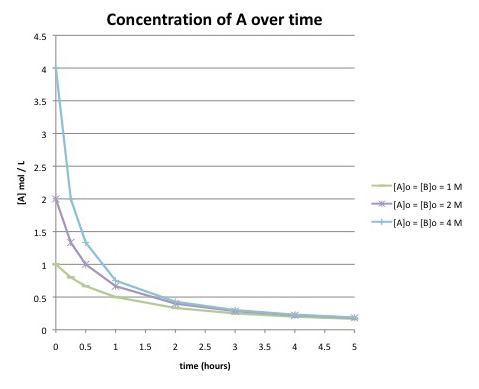
Suppose the following data were obtained by monitoring the following reaction to completion:
A + B ---> C
Compare this graph to the one in the previous problem. What differences can you detect in the curves? Do you think this reaction has the same rate law as the previous one?
This site was written by Chris P. Schaller, Ph.D., College of Saint Benedict / Saint John's University (retired) with other authors as noted on individual pages. It is freely available for educational use.

Structure & Reactivity in Organic,
Biological and Inorganic Chemistry by
Chris Schaller
is licensed under a
Creative Commons Attribution-NonCommercial 3.0 Unported License.
Send corrections to cschaller@csbsju.edu
This material is based upon work supported by the National Science Foundation under Grant No. 1043566.
Any opinions, findings, and conclusions or recommendations expressed in this material are those of the author(s) and do not necessarily reflect the views of the National Science Foundation.
Navigation:
Back to Web Materials on Structure & Reactivity in Chemistry