Reactivity in Chemistry
Reaction Kinetics
RK2. Reaction Rates
To get started, let's think about what is meant by "rate". The rate of a reaction is just its speed. Just as your speed when driving down the highway can be described in terms of your progress over time (in miles or kilometers per hour), a reaction can be described in terms of the progress of the reaction over time.
The reaction rate is the progress of the reaction over time.
Let's look at a very simple comparison of rates. We'll look at what might happen when we roll a ball along a sidewalk. We'll roll two balls, side by side: a red one and a blue one. We'll give the red ball a slightly harder push, and give the blue one a softer touch. Then we'll snap some pictures of the two balls as they roll along.
The following drawings are a sequence of these pictures. Let's assume we take a picture every second. You will notice that some kid has marked off a line every meter using sidewalk chalk.
Figure RK2.1. A race: Rolling two balls down the sidewalk.
What do we see? The red ball is going a little faster than the blue one. It is making more progress over time. But how much faster is it going?
Sometimes, it's useful to make a graph of our observations.
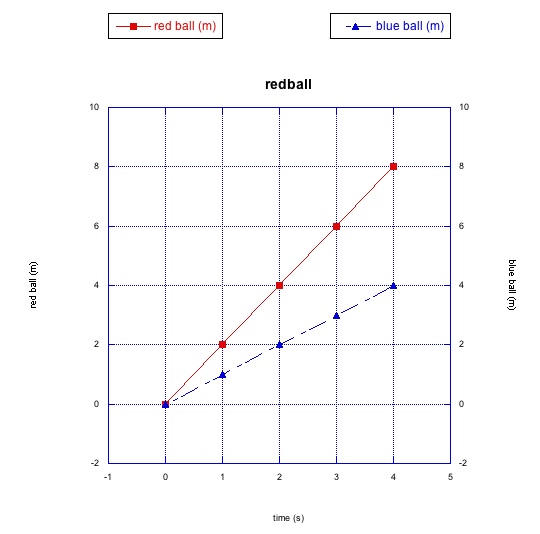
Figure RK2.2. Graphing a race between two balls down the sidewalk.
A graph lets us see the relationships among the data we have observed. In this case, the data is just the distance the ball has moved (in meters) and the time (in seconds). This particular relationship is described as a "linear relationship"; that just means that, when we graph the distance the ball has moved over time, we see a straight line. This is true for both the blue ball and the red ball. In this case, it tells us that both balls are moving at a steady speed.
Plotting data on a graph lets us see relationships very easily.
However, the red ball is moving more quickly than the blue ball. We can easily use the graph to measure exactly how much more quickly it is moving (you may also be able to do it just by looking at our pictures of the ball rolling along the sidewalk. We can use the slope of the line to determine the rate of change of distance with changing time.
For a straight line, slope = "rise"/"run"
"rise"/"run" = distance / time
distance / time = speed
The red ball moves 8 m in 4 s. Its speed is 2 m/s. The blue ball moves 4 m in 4 s. Its speed is 1 m/s. The red ball is moving twice as quickly as the blue ball.
That sort of comparison of rates of change is similar to what is done in chemical kinetics. Furthermore, we might try to explain why there is a difference between the two rates (in this case, we pushed the red ball harder than the blue ball).
Sometimes we can quantify comparisons using graphical analysis.
Let's look at another race between the red ball and the blue ball. This time, who knows? Maybe the blue one will win.
Figure RK2.3. Another race down the sidewalk.
Clearly, the red ball is faster than the blue one again. But let's see what else is made clear by graphing the data.
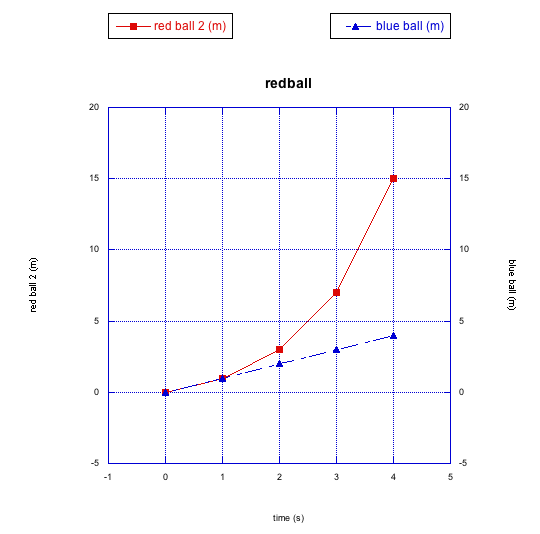
Figure RK2.4. Graphing the data shows a non-linear relationship (in this case, one ball is accelerating).
The blue ball is still moving at a steady rate. However, this time the red ball is getting faster and faster. The slope of the line between the last two data points is much higher than it is between the first two data points. In this case the red ball is accelerating; its speed is increasing over time.
The red ball doesn't obey a linear relationship between distance and time. This is a nonlinear relationship, instead. It may fit a polynomial expression, or some other nonlinear function.
Sometimes, rates are non-linear. The speed changes over time.
Again, the rate could be interpreted physically. The red ball may be accelerating because of some factor that is making it go faster and faster. Maybe the sidewalk is sloped on one side, so that the red ball is actually rolling slightly downhill.
Let's look at one more race between the red ball and the blue ball. This time, the balls have already been rolling for some time when we start taking pictures.
Figure RK2.5. A sidewalk race with more complicated things going on.
It looks like the blue ball starts out ahead, but it is soon passed by the red ball. When the progress is graphed, we can see a different kind of nonlinear relationship.
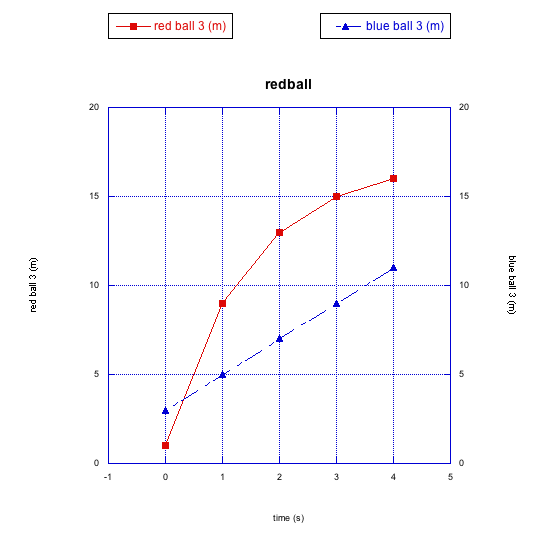
Figure RK2.6. Graphing this race shows the red ball is decelerating, and the blue one might catch up.
This time the red ball is decelerating. It is getting slower and slower. You can imagine that, if the blue ball keeps rolling steadily along like it has so far, it may eventually pass the red ball again. This deceleration of the red ball is a different type of non-linear relationship.
Why is the red ball slowing down, but the blue one is not? Maybe the sidewalk is uneven again, but this time the red ball is going uphill. You might be able to come up with other reasons, too.
Reaction Rates
Let's take a look at molecules and reactions. This time, instead of tracking distance over time, we will look at the number of molecules present over time. Maybe we are looking at two reactions. One reaction produces red molecules. The other produces blue molecules.
This is more like what we are talking about when we look at chemical kinetics. We are looking at changes in the amount of a compound over time. In this case, the picture makes it look like the red molecules are produced more quickly than the blue molecules. The red molecules and blue molecules are produced at two different rates.
Figure RK2.7. The growth of products in two different reactions.
Reaction kinetics looks at changes in the amount of compounds present over time.
This example may look a little unrealistic. The molecules are appearing from out of nowhere, and of course they can't do that. Something can't be made from nothing. We'll see other examples in which the origin of the new molecules is more clear.
Problem RK2.1.
a) Draw a graph showing the rate of production of red molecules in the picture above (graph the number of red molecules vs. time).
b) Draw a graph showing the rate of production of blue molecules.
c) Compare the rates of production of the two kinds of molecules.
Problem RK2.2.
a) Make a drawing of molecules changing over time. This time, instead of more molecules appearing over time, make molecules disappear over time, at a constant rate.
b) Draw a graph corresponding with your series of pictures.
Problem RK2.3.
The following rows of flasks show two different scenarios.
a) Describe what is happening in the first row.
b) Graph what is happening in the first row.
c) Describe what is happening in the second row.
d) Graph what is happening in the second row.
e) Compare what is happening in the first row to what is happening in the second row.
Problem RK2.4.
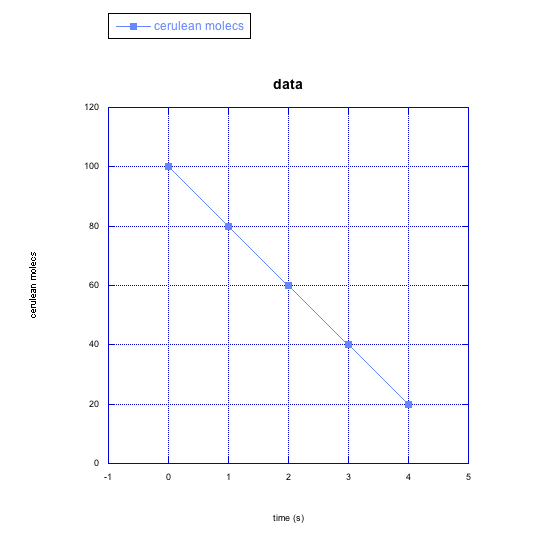
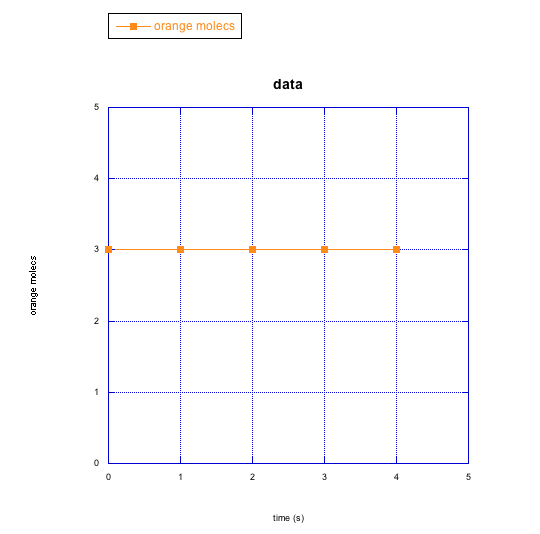
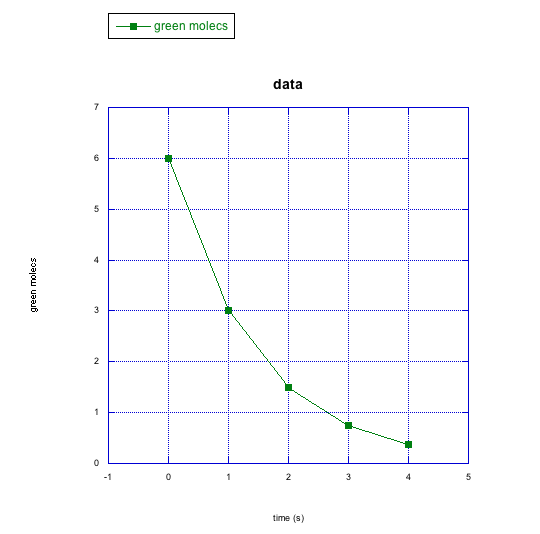
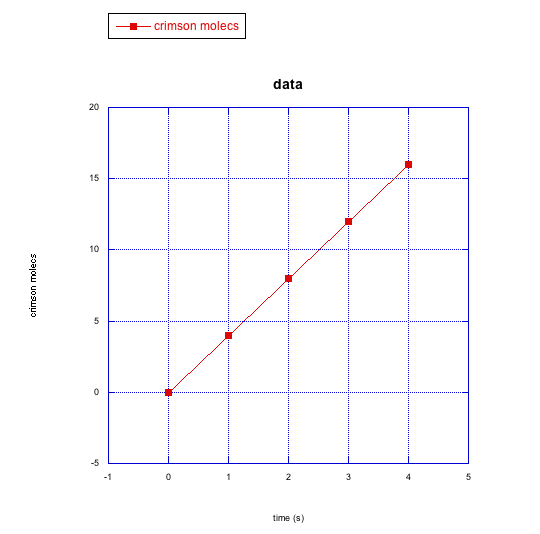
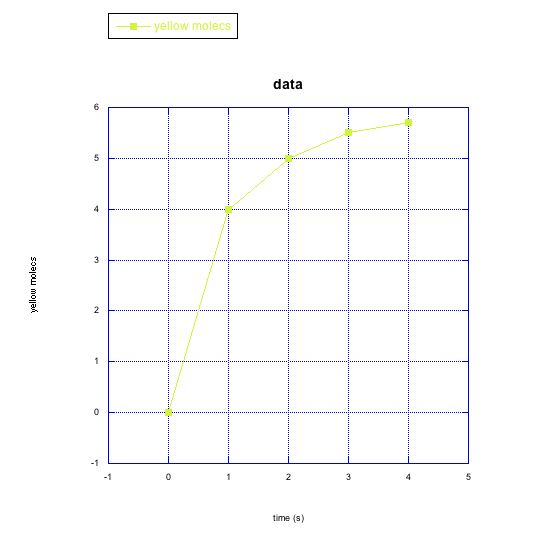
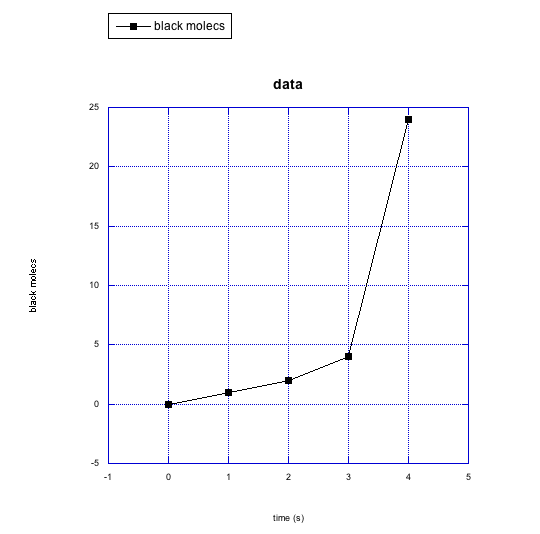
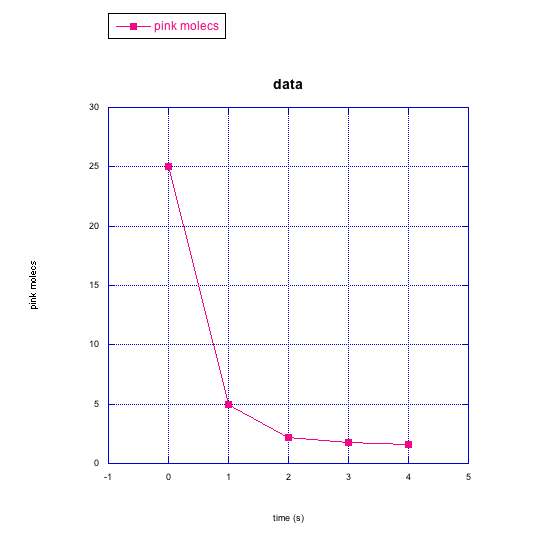
The following graphs show changes in the number of molecules over time. Describe what is happening to the number of molecules (increasing? decreasing?) and to the rate at which changes are taking place (staying the same? getting faster? getting slower?).
a)
b)
c)
d)
e)
f)
g)
Problem RK2.5.
For the following cases in problem RK4, make a qualitative graph showing what you think is happening to the rate of the reaction over time (e.g. Do you think the rate is increasing over time? How would you show that on a graph?)
a) cerulean molecules
b) orange molecules
c) green molecules
d) crimson molecules
e) yellow molecules
f) black molecules
g) pink molecules
Problem RK2.6.
How would you describe the similarities between the changes in the green molecules and the pink molecules in the previous questions? What about the differences?
Problem RK2.7.
Frequently, instead of just plotting changes in one compound, we might graph changes in two things at once. That way, we can look for relationships between them.
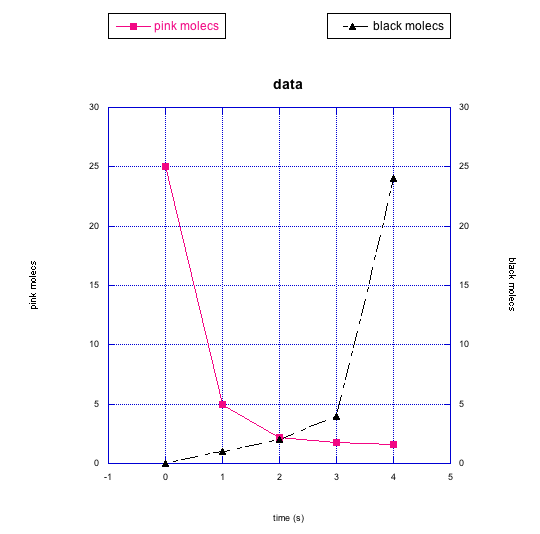
In the following graphs, pink molecules are reacting to form another type of molecule.
Are the pink molecules turning into black molecules or indigo molecules? How can you tell?
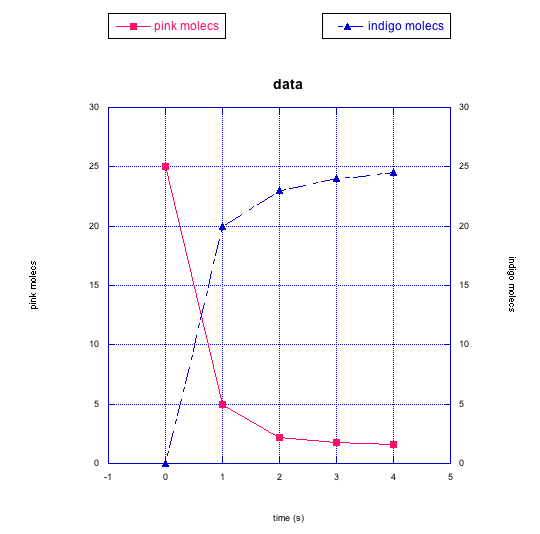
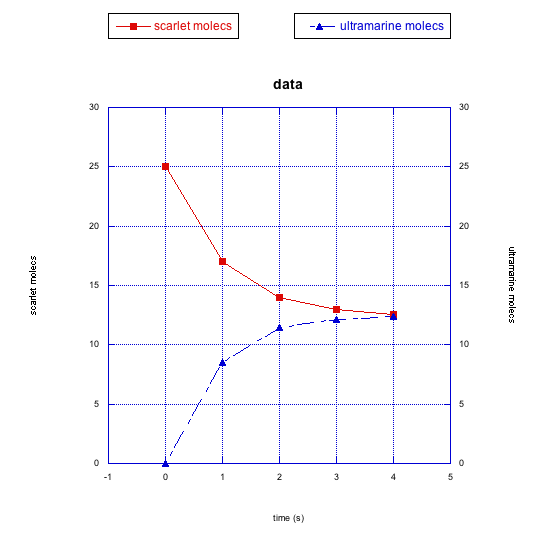
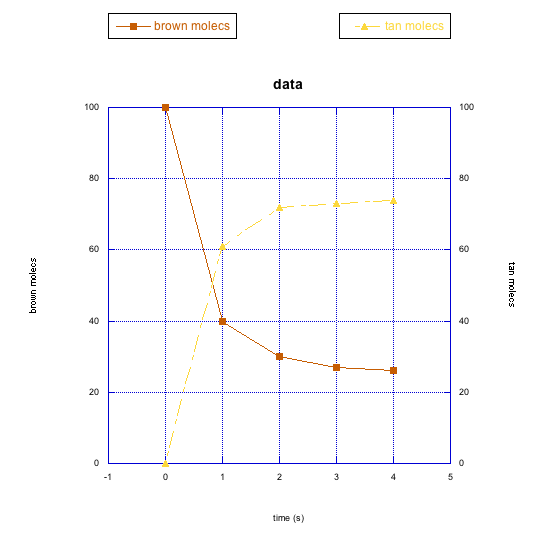
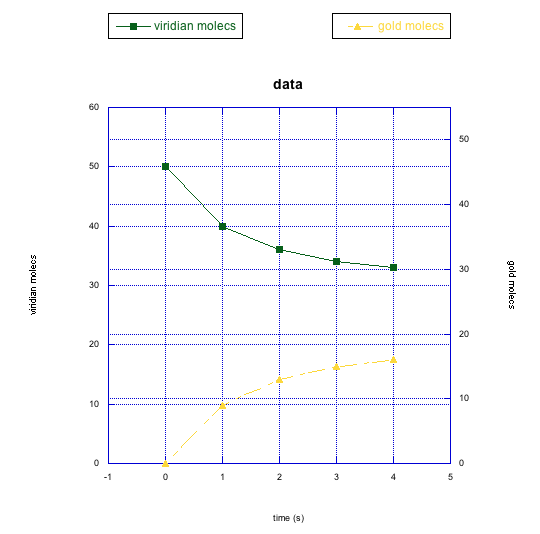
Problem RK2.8.
The following graphs also show changes in two different compounds at once. Describe what you think is happening in each case.
This site was written by Chris P. Schaller, Ph.D., College of Saint Benedict / Saint John's University (retired) with other authors as noted on individual pages. It is freely available for educational use.

Structure & Reactivity in Organic,
Biological and Inorganic Chemistry by
Chris Schaller
is licensed under a
Creative Commons Attribution-NonCommercial 3.0 Unported License.
Send corrections to cschaller@csbsju.edu
This material is based upon work supported by the National Science Foundation under Grant No. 1043566.
Any opinions, findings, and conclusions or recommendations expressed in this material are those of the author(s) and do not necessarily reflect the views of the National Science Foundation.
Navigation:
Back to Web Materials on Structure & Reactivity in Chemistry