Reactivity in Chemistry
Radical Reactions
RR11. Detection of Unpaired Electrons
There are experimental methods for the detection of unpaired electrons. One of the hallmarks of unpaired electrons in materials is interaction with a magnetic field. That interaction can be used to provide information about compounds containing unpaired electrons.
Electron Paramagnetic Resonance
Electron paramagnetic resonance (EPR) or electron spin resonance (ESR) is a spectroscopic method. It depends upon the energetic separation of two spin states that exists only in the presence of a magnetic field.
EPR is very closely related to another common type of spin resonance spectroscopy, NMR.
Spin is a quantum property that is associated with magnetism. An electron can have either of two values for spin. There are various labels given to these values: sometimes "up" and "down", sometimes, +1/2 and -1/2. However, whichever value of spin an electron possesses makes no difference energetically.
![]()
Figure RR11.1. Two possible spin states for an unpaired electron.
The two possible spin states are the same energetically -- unless a magnetic field is present. Once that situation arises, there is an energetic separation between the two states.
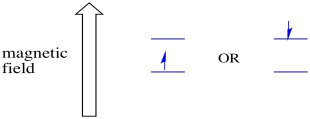
Figure RR11.2. Two possible spin states are at different energy levels in an external magnetic field.
In the presence of a magnetic field, the two spin states separate into two different energy levels. The amount of separation between the energy levels depends on the magnitude of the magnetic field. The stronger the magnetic field, the greater the separation.
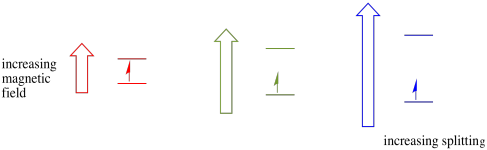
Figure RR11.3. The effect of increasing external magnetic field on the energy difference between spin states in an observed sample.
This case is only true for unpaired spins. Remember, unpaired spins interact with a magnetic field. If everything is spin-paired, nothing happens. That's very useful, because it gives us a way to detect those unpaired electrons.
An electron in one spin state can still be excited to the other by the absorbance of a photon. Alternatively, an electron in the higher state can drop down to the lower one if it releases a photon. In this case, the photons associated with these transitions are very low in energy, from the radio wave portion of the electromagnetic spectrum.
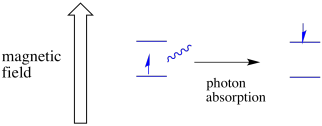
Figure RR11.4. A photon of electromagnetic radiation can excite an electron from one level to the next.
In order for any of this to happen, the energy of the photon must exactly match the energy difference between states. This Goldilocks rule is called the resonance condition. The amount of energy supplied to jump from one energy level to the next has to be just right. Too little energy and the electron won't make it. Too much energy and the electron won't make it either. It's waiting for just the right photon.
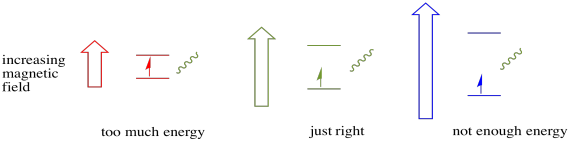
Figure RR11.5. The Goldilocks principle: a photon has to have just the right amount of energy to excite an unpaired electron.
Just how much energy does a photon have? Remember your Planck-Einstein relationship. It described the energy of a photon:
E = hν
E is the energy of the photon, h is Planck's constant (6.625 x 10⁻³⁴ Js) and ν is the frequency of the photon (it looks like a Roman vee, but it's the Greek letter, nu).
Alternatively, because of the relationship between wavelength and frequency:
E = hc/λ
The new quantities are c, the speed of light (3.0 x 10⁸ m s-1) and λ, the wavelength of the photon.
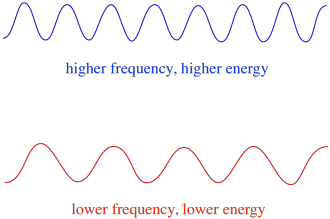
Figure RR11.6. The energy of a photon is directly related to its frequency, or inversely related to its wavelength.
So, in general, different wavelengths of light deliver different amounts of energy. Blue light, with a wavelength close to 475 nm, has more energy than red light, with a wavelength close to 700 nm.
In EPR, the general range of electromagnetic radiation, or the general kind of photon, is microwave radiation. The frequency of these photons is about 9 or 10 GHz. (Another type of spectroscopy, rotational spectroscopy, also measures the absorbance of microwaves. It typically uses somewhat higher frequencies of microwaves. Rotational spectroscopy gives structural or bonding information about molecules in the gas phase.)
Depending on the environment of the unpaired electron, it may be more susceptible or less susceptible to the influence of the external magnetic field. That means the energy splitting between the two spin states will vary from one molecule to another. As a result, different molecules in the same magnetic field would absorb different wavelengths of microwave radiation.
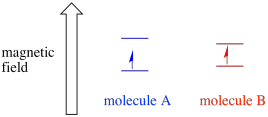
Figure RR11.7. Two different molecules with unpaired electrons may have different energy gaps between their spin states.
Usually, an EPR spectrometer is designed so that it supplies a fixed wavelength of microwave radiation to the sample. The magnetic field is adjusted and the instrument measures what field strength was required for absorption of the photons. An EPR spectrum shows absorbance as a function of magnetic field strength.

Figure RR11.8. A cartoon of an "integrated" EPR spectrum.
There is something a little different about how EPR spectra are usually displayed. It is displayed as a derivative of the plot shown above. That's because of the way that the instrument measures the change in absorbance as it changes the magnetic field; i.e. it measures d(absorbance)/d(magnetic field). That's the slope of the previous plot.

Figure RR11.9. Measuring slopes in the integrated EPR spectrum.
As a result, an EPR spectrum really looks more like this. The part above the baseline reflects the positive slope in the previous plot. The part below the baseline reflects the negative slope in the previous plot.

Figure RR11.10. A cartoon of the "differential" form of an EPR spectrum.
The magnetic field strength is not typically the value that is reported for the peak position. Instead, something called the g-value is reported. The g-value arises from the equation for the Zeeman effect (the effect of the magnetic field on the splitting between spin energy levels). That relationship is:
ΔE = gβB
in which ΔE is the energy difference between spin states, g is the g-value, a proportionality constant that depends on how susceptible the electron is to the influence of the magnetic field, β is the Bohr magneton (9.274 x 10⁻²⁴ J T-1) and B is the applied magnetic field.
That means that, for photon absorption,
hν = gβB
and so
g = hν/βB
Remember, h and β are just constants. That means g is a measure of the ratio of the photon absorbed to the magnetic field used. It's a standardisation step. If people have instruments that use slightly different wavelengths of microwave radiation, then the magnetic fields they measure for the same samples would not agree. If everyone just measures the ratio of wavelength to field strength, it should all even out. The g-value is a reproducible measure of the environment of an electron that should be the same from one laboratory to another.
A similar practice is used in NMR spectroscopy, for similar reasons. When we report a chemical shift in ppm instead of Hz, we are correcting for the strength of the magnetic field in the instrument we are using. Otherwise the same sample would give two different shifts on two different instruments.
Coupling in EPR
Coupling is a phenomenon in which magnetic fields interact with each other. In EPR, coupling comes about because of the influence of nearby nuclei on the electron that is being observed.
For example, you may already know that a hydrogen atom's nucleus has an unpaired spin. That's the basis of 1H NMR spectroscopy. If that nucleus has an unpaired spin, it has an associated magnetic field. Because the hydrogen nucleus could have either spin value, +1/2 or -1/2, then it has two possible magnetic fields associated with it.
A nearby electron, placed in an external magnetic field, could now be in either of two different situations. Either the neighbouring proton adds a little bit to the magnetic field, or it subtracts a little bit from the external field.
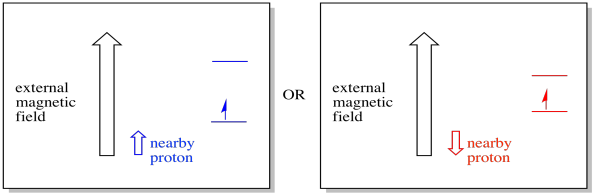
Figure RR11.11. An electron may experience a local magnetic field from a nearby proton.
As a result, the electron can experience two different fields. Remember, we are not dealing with a single molecule in spectroscopy. We are dealing with huge numbers of molecules. Some of the molecules will be in one situation. Some of the molecules will be in the other situation. We will see both situations. There will be absorbance at two different magnetic field strengths.
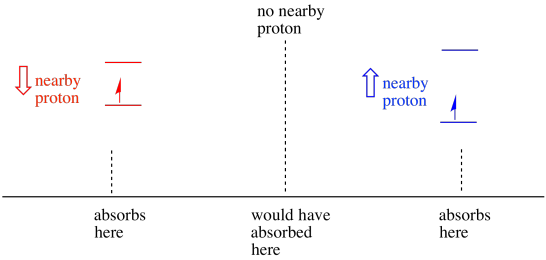
Figure RR11.12. In the presence of a nearby proton, an unpaired electron will absorb at two different frquencies.
As a result, the EPR spectrum shows two peaks, like this:

Figure RR11.13. A cartoon of coupling in an EPR spectrum. This peak is a doublet.
This type of peak in the spectrum is called a doublet, because of the double absorbance. This characteristic of an EPR peak is called its multiplicity. How many lines is the peak split into? Two. It is a doublet.
Things are even more interesting if there are two nearby protons. In that case, both neighbouring protons have spin. Either spin could have value +1/2 or -1/2. Maybe they are both +1/2. Maybe they are both -1/2. Maybe there is one of each. These three possible combinations will have three different effects on the magnetic field experienced by the electron.
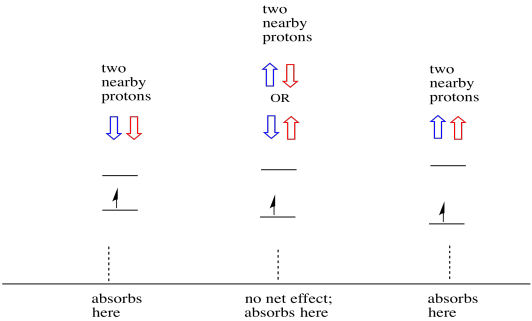
Figure RR11.14. Two nearby protons result in three local magnetic environments for the unpaired electron.
As a result, there are three peaks in the spectrum. The spectrum is called a triplet. This triplet is shown below, underneath the diagram that illustrates the spin combinations of the neighbouring hydrogens.
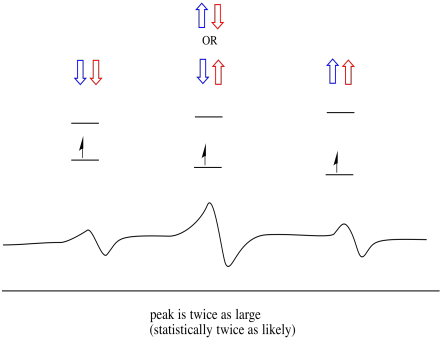
Figure RR11.15. A cartoon of a triplet in an EPR spectrum.
Notice that, because either hydrogen could be up or down in the mixed combination, there are two ways of arriving at that middle state. That combination is twice as likely as the other two, because there is only one way of getting those combination: both hydrogens' spins are up, in one case. Both hydrogens are down in the other. As a result, the middle peak in a triplet is twice as large as the peaks on the edges.
Problem RR11.1.
Show that, with three neighbouring hydrogens, a quartet would result, in which the ratios of the peaks are 1:3:3:1.
Problem RR11.2.
Predict the multiplicity in the EPR spectrum for each of the following alkoxy radicals (note that oxygen and carbon have no unpaired spins; assume the same is true for X):
a) X3C-O. b) X2CH-O. c) XCH2-O. d) CH3-O.
Problem RR11.3.
Suppose benzene were reduced by one electron to obtain the benzene radical anion. What would be the multiplicity in the EPR spectrum?
Coupling to Metal Ions
Lots of nuclei other than hydrogen have a net spin. If the unpaired electron happens to be found on a metal, the EPR spectrum may provide confirmation of that structural information. This confirmation may come from both the magnetic field information (similar to chemical shift in NMR) and from the multiplicity.
Nuclear spins of selected metals are shown below.
| Metal | Spin |
| V | 7/2 |
| Mn | 5/2 |
| Fe | 0 |
| Co | 7/2 |
| Cu | 3/2 |
In each of these metals, the nucleus has different possible magnetic fields. Note that their effects are slightly more complicated than that of a hydrogen atom. For example, copper, with spin 3/2, acts a little like three different hydrogen nuclei (each with spin +/- 1/2) in terms of its effect on a nearby electrom's EPR spectrum. The multiplicity of an unpaired electron on a copper ion should be pretty distinctive.
Problem RR11.4.
Predict the multiplicity of a peak in the EPR spectrum for an unpaired electron on each of the following metals:
a) vanadium b) manganese c) iron d) cobalt e) copper
Sometimes things are more complicated, because different isotopes of the same element may have different possible spin values. In fact, that is true with hydrogen and carbon, but the great majority of hydrogen is found as 1H, so in general we can think of it as having spin = 1/2; the great majority of carbon is 12C, with spin = 0.
The natural isotopes of iron, and their nuclear spins, are shown in the table below.
| Isotope | Spin | % Abundance |
| 54Fe | 0 | 5.9 |
| 56Fe | 0 | 91.8 |
| 57Fe | 1/2 | 2.1 |
| 58Fe | 0 | 0.2 |
The EPR spectrum of an unpaired electron on iron may be slightly more complicated than we first thought. Within the sample, some of the electrons would be situated on iron ions with spin = 1/2, although most would not. This complication may be enough to introduce a slight variation in the appearance of the spectrum, but overall it would still look pretty much like a singlet, because most of the iron atoms have zero spin.
However, in many cases things do get much more complex. Molybdenum provides a good example.
| Isotope | Spin | % Abundance |
| 92Mo | 0 | 14.8 |
| 94Mo | 0 | 9.3 |
| 95Mo | 5/2 | 15.9 |
| 96Mo | 0 | 16.7 |
| 97Mo | 5/2 | 9.6 |
| 98Mo | 0 | 24.1 |
| 100Mo | 0 | 9.6 |
There are seven naturally occurring isotopes of molybdenum. Five of them have spin = 0, so an unpaired electron on those isotopes would give rise to a simple singlet in the EPR spectrum. The other two isotopes, comprising 25% of the total, have spin = 5/2. Most unpaired electrons on molybdenum would show up as a singlet. However, a significant fraction would show up as a sextet. That means that, in an ideal case, an unpaired electron on molybdenum would give rise to a singlet with a sextet superimposed on it (about a quarter as strong as the singlet).
This situation might look something like the drawing below.

Figure RR11.1. The presence of metal nuclei can complicate EPR spectra.
In reality, EPR spectra are enormously complicated in many cases. They often look like fuzzy blobs. There are so many things coupling to so many other things that it becomes almost impossible to decipher by eye. In most cases, computer simulations are run and the experimental data is compared to the computer simulations to obtain structural insight.
Problem RR11.5.
Vanadium is present in some nitrogenases and so there has been interest in model complexes (e.g. Sandro Gambarotta et al, J. Am. Chem. Soc. 1994, 116, 6927-6928). Gambarotta used the following synthesis, in THF solvent:
VCl3 + [(Me3Si)2N]K → [(Me3Si)2N]3V(THF)
a) Draw the structure of the product of the reaction.
b) Draw a d orbital splitting diagram for this complex.
c) An EPR spectrum was recorded for this compound. Sketch the spectrum, given that vanadium has nuclear spin I = 7/2.
d) Estimate μeff for this compound.
The compound reacts with N2, forming a N2-bridged dimer.
e) Draw the structure of this product.
f) This compound produces no EPR spectrum. Provide a resonance structure of (e) that explains this observation.
EPR spectra provided courtesy of Virtual Imagination / Slapdash Chemistry Creations.
This site is written and maintained by Chris P. Schaller, Ph.D., College of Saint Benedict / Saint John's University (retired) with contributions from other authors as noted. It is freely available for educational use.

Structure & Reactivity in Organic, Biological and Inorganic Chemistry by Chris Schaller is licensed under a Creative Commons Attribution-NonCommercial 3.0 Unported License.
This material is based upon work supported by the National Science Foundation under Grant No. 1043566.
Any opinions, findings, and conclusions or recommendations expressed in this material are those of the author(s) and do not necessarily reflect the views of the National Science Foundation.
Navigation: