Reactivity in Chemistry
Reduction & Oxidation Reactions
RO9. Outer Sphere Electron Transfer
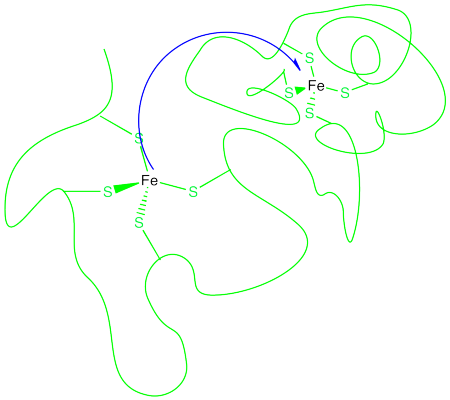
How does an electron get from one metal to another? This might be a more difficult task than it seems. In biochemistry, an electron may need to be transfered a considerable distance. Often, when the transfer occurs between two metals, the metal ions may be constrained in particular binding sites within a protein, or even in two different proteins.

Figure RO9.1. An electron transfer between two iron atoms in fixed positions apart from each other.
That means the electron must travel through space to reach its destination. Its ability to do so is generally limited to just a few Angstroms (remember, an Angstrom is roughly the distance of a bond). Still, it can react with something a few bond lengths away. Most things need to actually bump into a partner before they can react with it.
This long distance hop is called an outer sphere electron transfer. The two metals react without ever contacting each other, without getting into each others' coordination spheres. Of course, there are limitations to the distance involved, and the further away the metals, the less likely the reaction. But an outer sphere electron transfer seems a little magical.
Perhaps the most obvious factor that might influence how easily an electron can travel from one metal to another is the nature of the medium through which it must travel. It is not really traveling through empty space. Most often, reactions happen in solution, so the electron has to travel through a solvent to get to its destination. How will the nature of the solvent influence electron transfer?
The important thing to remember here is that an electron is charged. We are used to thinking of charged species always traveling around with a counterion nearby, but this electron needs to travel all by itself. It can't be very stable on its own, and so it will need to be stabilized somehow. Consequently, interactions with the seolvent will be very important. Solvents with a higher direlectric constant (stemming from higher molecular dipoles) will be better able to stabilize this lone electron than non-polar solvents, and so we expect oouter sphere electron transfer to occur more easily in polar solvents.
Other Barriers to Reaction: A Qualitative Picture of Marcus Theory
So, what else holds the electron back? What is the barrier to the reaction?
Rudy Marcus at Caltech has developed a mathematical approach to understanding the kinetics of electron transfer, in work he did beginning in the late 1950's. We will take a very qualitative look at some of the ideas in what is referred to as "Marcus Theory".
An electron is small and very fast. All those big, heavy atoms involved in the picture are lumbering and slow. The barrier to the reaction has little to do with the electron's ability to whiz around, although even that is limited by distance. Instead, it has everything to do with all of those things that are barely moving compared to the electron.
Imagine an iron(II) ion is passing an electron to an iron(III) ion. After the electron transfer, they have switched identities; the first has become an iron(III) and the second has become an iron(II) ion.
Nothing could be simpler. The trouble is, there are big differences between an iron(II) ion and an iron(III) ion. For example, in a coordination complex, they have very different bond distances. Why is that a problem? Because when the electron hops, the two iron atoms find themselves in sub-optimal coordination environments.
Problem RO9.1.
Suppose an electron is transferred from an Fe(II) to a Cu(II) ion. Describe how the bond lengths might change in each case, and why. Don't worry about what the specific ligands are.
Problem RO9.2.
In reality, a bond length is not static. If there is a little energy around, the bond can lengthen and shorten a little bit, or vibrate. A typical graph of molecular energy vs. bond length is shown below.
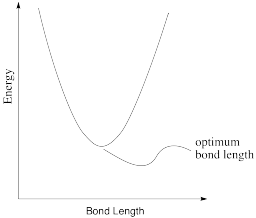
a) Why do you think energy increases when the bond gets shorter than optimal?
b) Why do you think energy increases when the bond gets longer than optimal?
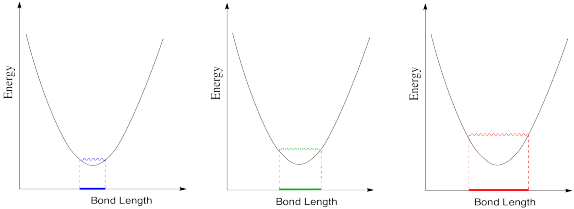
c) In the following drawings, energy is being added as we go from left to right. Describe what is happening to the bond length as available energy increases.
Problem RO9.3.
The optimum C-O bond length in a carbon dioxide molecule is 1.116 Å. Draw a graph of what happens to internal energy when this bond length varies between 1.00 Å and 1.20 Å. Don't worry about quantitative labels on the energy axis.
Problem RO9.4.
The optimum O-C-O bond angle in a carbon dioxide molecule is 180 °. Draw a graph of what happens to internal energy when this bond angle varies between 170 ° and 190 °. Don't worry about quantitative labels on the energy axis.
The barrier to electron transfer has to do with reorganizations of all those big atoms before the electron makes the jump. In terms of the coordination sphere, those reorganizations involve bond vibrations, and bond vibrations cost energy. Outside the coordination sphere, solvent molecules have to reorganize, too. Remember, ion stability is highly influenced by the surrounding medium.
Problem RO9.5.
Draw a Fe(II) ion and a Cu(II) ion with three water molecules located somewhere in between them. Don't worry about the ligands on the iron or copper. Show how the water molecules might change position or orientation if an electron is transferred from iron to copper.
Thus, the energetic changes needed before electron transfer can occur involve a variety of changes, including bond lengths of several ligands, bond angles, solvent molecules, and so on. The whole system, involving both metals, has some optimum set of positions of minimum energy. Any deviations from those positions requires added energy. In the following energy diagram, the x axis no longer defines one particular parameter. Now it lumps all changes in the system onto one axis. This picture is a little more abstract than when we are just looking at one bond length or one bond angle, but the concept is similar: there is an optimum set of positions for the atoms in this system, and it would require an input of energy in order to move any of them move away from their optimum position.
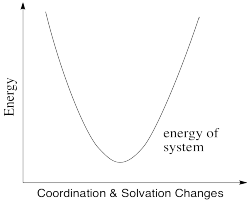
Figure RO9.2. A plot of energy (y axis) vs the magnitude of any changes in solvation or coordination geometry (x axis).
It is thought that these kinds of reorganizations -- involving solvent molecules, bond lengths, coordination geometry and so on -- actually occur prior to electron transfer. They happen via random motions of the molecules involved. However, once they have happened, there is nothing to hold the electron back. Its motion is so rapid that it can immediately find itself on the other atom before anything has a chance to move again.
Consequently, the barrier to electron transfer is just the amount of energy needed for all of those heavy atoms to get to some set of coordinates that would be accessible in the first state, before the electron is transferred, but that would also be accessible in the second state, after the electron is transfered.
Problem RO9.6.
Describe some of the changes that contribute to the barrier to electron transfer in the following case.

In the drawing below, an electron is transferred from one metal to another metal of the same kind, so the two are just switching oxidation states. For example, it could be an iron(II) and an iron(III), as pictured in the problem above. In the blue state, one iron has the extra electron, and in the red state it is the other iron that has the extra electron. The energy of the two states are the same, and the reduction potential involved in this trasfer is zero. However, there would be some atomic reorganizations needed to get the coordination and solvation environments adjusted to the electron transfer. The ligand atoms and solvent molecules have shifted in the change from one state to another, and so our energy surfaces have shifted along the x axis to reflect that reorganization.
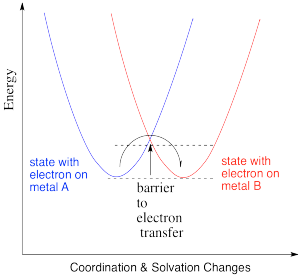
Figure RO9.3. A barrier to electron transfer when an electron moves from an energy surface that describes one state to an energy surface that describes another.
The change in x axis value just reflects the magnitude of geometric and solvation changes. That's the magnitude of all changes, not a vector sum. It's the sum of the absolute values of all changes; it doesn't matter that one bond is getting longer and another is getting shorter. One bond changes length by x1 and another bond changes length by x2. The total amount of changes has been x1 + x2. We're not cancelling out because one bond got longer and another bond got shorter. We want to know about the size of all of the changes that had to take place for the reaction to happen.
That example isn't very interesting, because we don't form anything new on the product side. As a result, the energy doesn't change from before the transfer to after. Instead, let's picture an electron transfer from one metal to a very different one. For example, maybe the electron is transferred from cytochrome c to the "copper A" center in cytochrome c oxidase, an important protein involved in respiratory electron transfer.
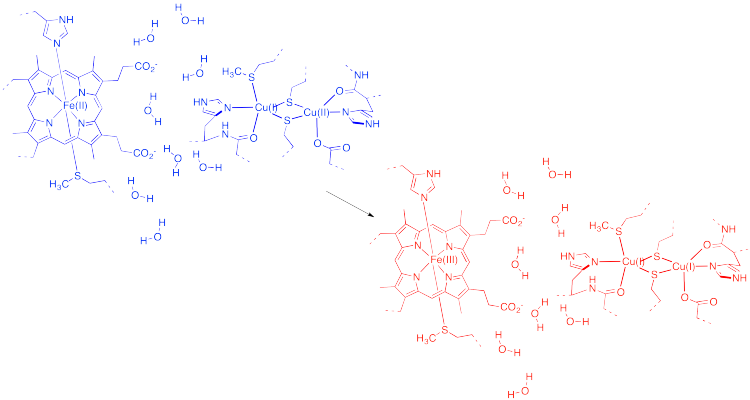
Figure RO9.4. Electron transfer from cytochrome c to cytochrome c oxidase.
Problem RO9.7.
In the drawing above, some water molecules are included between the two metal centres.
a) Explain what happens to the water molecules in order to allow electron transfer to occur, and why.
b) Suppose there were a different solvent, other than water, between the complexes. How might that affect the barrier to the reaction?
The energy diagram for the case involving two different metals is very similar, except that now there is a difference in energy between the two states. The reduction potential is no longer zero. We'll assume the reduction potential is positive, and so the free energy change is negative. Energy goes down upon electron transfer.
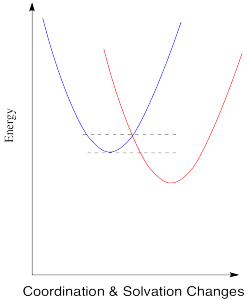
Figure RO9.5. A barrier to electron transfer when an electron transfer is exothermic.
Compare this picture to the one for the degenerate case, when the electron is just transferred to a new metal of the same type. A positive reduction potential (or a negative free energy change) has the effect of sliding the energy surface for the red state downwards. As a result, the intersection point between the two surfaces also slides downwards. Since that is the point at which the electron can slide from one state to the other, the barrier to the reaction decreases.
What would happen if the reduction potential were even more positive? Let's see in the picture below.
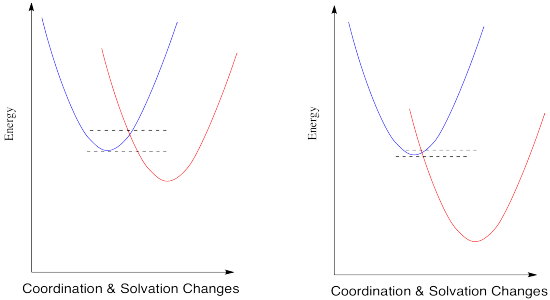
Figure RO9.5. A barrier to electron transfer when an electron transfer is more and more exothermic.
The trend continues. According to this interpretation of the kinetics of electron transfer, the more exothermic the reaction, the lower its barrier will be. It isn't always the case that kinetics tracks along with thermodynamics, but this might be one of them.
But is all of this really true? We should take a look at some experimental data and see whether it truly works this way.
Table RO9.1. Reduction potentials and reaction rates of some Co(III) complexes with a common reducing agent.
| Oxidant | E° | k (M-1s-1) (margin of error shown in parentheses) |
| Co(diene)(NH3)23+ | 0.12 | 3.0(4) |
| Co(diene)(H2O)NCS2+ | 0.38 | 11(1) |
| Co(diene)(H2O)23+ | 0.53 | 800(100) |
| Co(EDTA) | 0.60 | 6000(1000) |
As the reduction potential becomes more positive, free energy gets more negative, and the rate of the reaction dramatically increases. So far, Marcus theory seems to get things right.
Problem RO9.8.
a) Plot the data in the above table.
b) How would you describe the relationship? Is it linear? Is it exponential? Is it direct? Is it inverse?
c) Plot rate constant versus free energy change. How does this graph compare to the first one?
Before we get to the next part, there is one more barrier of reorganization that we haven't considered yet. We have thought about how bond lengths may need to get longer or shorter within the coordination complex as the metal changes its charge, and about how the outer coordination sphere of solvent molecules may shift subtly to accommodate these changes. There is also a reorganizational requirement that sometimes occurs in the metal ion itself.
Suppose we started with a M(III) ion that was low spin and we reduced this metal ion to M(II), at which point it became high spin because of that lower charge on the metal. Suddenly we would have electrons that used to be in lower energy orbitals that would have to move to higher orbitals. In effect, not just one electron has to move in this case. One electron moves between metals, but it causes additional electrons to have to move within the same metal.
This electronic reorganization might be equally necessary going the other direction. A high spin metal that gets oxidized might suddenly become low spin, and some of its electrons may have to adjust by dropping down to lower energy orbitals.
Marcus Inverted Region
When you look a little closer at Marcus theory, though, things get a little strange. Suppose we make one more change and see what happens when the reduction potential becomes even more positive.
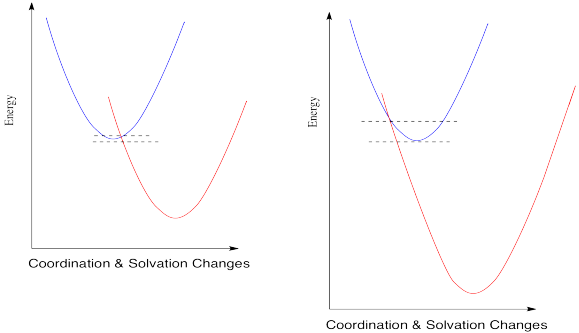
Figure RO9.6. An increasing barrier to electron transfer when an electron transfer becomes extremely exothermic.
So, if Marcus is correct, at some point as the reduction potential continues to get more positive, reactions start to slow down again. They don't just reach a maximum rate and hold steady at that plateau; the barrier gets higher and higher and the reactions get slower and slower. If you feel a little skeptical about that, you're in good company.
Marcus always maintained that this phenomenon was a valid aspect of the theory, and not just some aberration that should be ignored. The fact that nobody had ever actually observed such a trend didn't bother him. The reason we didn't see this kind of thing, he said, was that we just hadn't developed technology that was good enough to measure these kind of rates accurately.
But technology did catch up. Just take a look at the following data (from Miller, J. Am.Chem. Soc. 1984, 3047).
Table RO9.2. Some very fast electron transfer rates versus reduction potential.
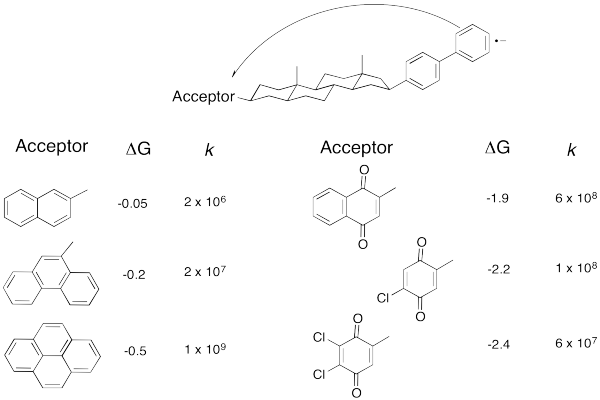
Don't worry that there are no metals involved anymore. An electron transfer is an electron transfer. Here, an electron is sent from the aromatic substructure on the right to the substructure on the left. By varying the part on the left, we can adjust the reduction potential (or the free energy change, as reported here.
Problem RO9.9.
a) Plot the data in the above table.
b) How would you describe the relationship?
As the reaction becomes more exergonic, the rate increases, but then it hits a maximum and decreases again. Data like this means that the "Marcus Inverted Region" is a real phenomenon. Are you convinced? So were other people. In 1992, Marcus was awarded the Nobel Prize in Chemistry for this work.
Problem RO9.10.
Take a look at the donor/acceptor molecule used in Williams' study, above. a) Why do you suppose the free energy change is pretty small for the first three compounds in the table? b) Why does the free energy change continue to get bigger over the last three compounds in the table?
Problem RO9.11.
The rates of electron transfer between cobalt complexes of the bidentate bipyridyl ligand, Co(bipy)3n+, are strongly dependent upon oxidation state in the redox pair. Electron transfer between Co(I)/Co(II) occurs with a rate constant of about 109 M-1s-1, whereas the reaction between Co(II)/Co(III) species proceeds with k = 18 M-1s-1.
a) What geometry is adopted by these complexes?
b) Are these species high spin or low spin?
c) Draw d orbital splitting diagrams for each complex.
d) Explain why electron transfer is so much more facile for the Co(I)/Co(II) pair than for the Co(II)/Co(III) pair.
This site was written by Chris P. Schaller, Ph.D., College of Saint Benedict / Saint John's University (retired) with other authors as noted on individual pages. It is freely available for educational use.

Structure & Reactivity in Organic,
Biological and Inorganic Chemistry by
Chris Schaller
is licensed under a
Creative Commons Attribution-NonCommercial 3.0 Unported License.
Send corrections to cschaller@csbsju.edu
This material is based upon work supported by the National Science Foundation under Grant No. 1043566.
Any opinions, findings, and conclusions or recommendations expressed in this material are those of the author(s) and do not necessarily reflect the views of the National Science Foundation.
Navigation: