Introduction
What is the radon concentration in your home? That depends on which room you measure and
what time that you measure. If you are interested in radon because of its health risk, you
should make a measurement in the rooms that are frequently occupied by people.
Hour-to-hour
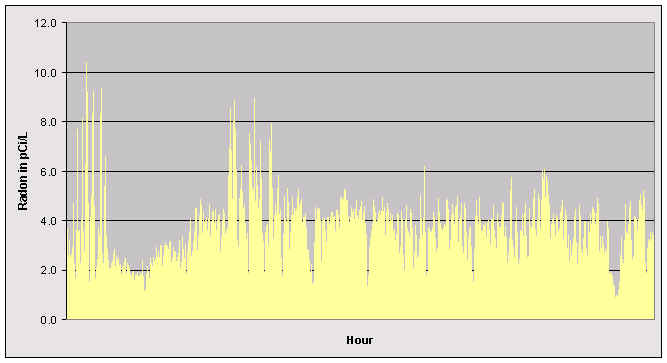
Here is a graph of the hourly average radon in a house from the beginning of January to the end of March 1995. Note that the average radon concentration ranged from a high of 10 pCi/L to less than 1 pCi/L. The true average over the period was 3.8 pCi/L. That's why a measurement that lasts only a few hours can give such a false reading of the long term average.
Day-to-day
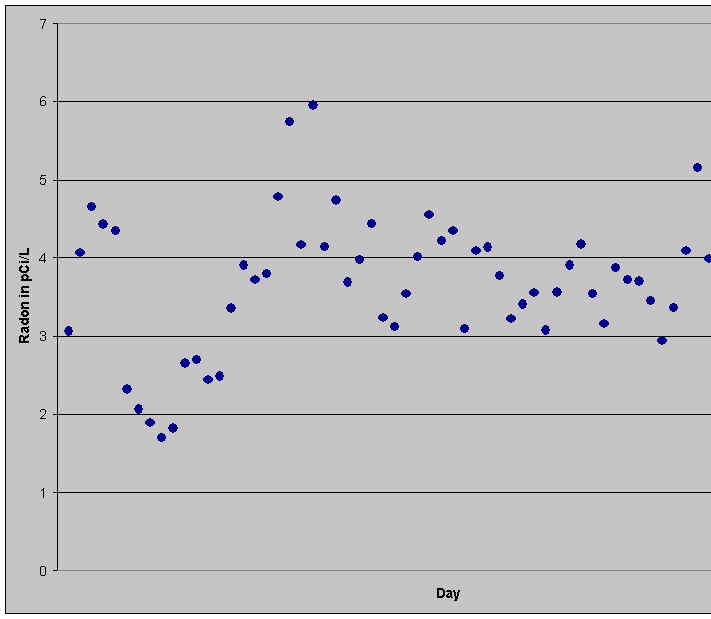
Here is a graph of the average radon in a house for each 2 day (48 hour) period from the beginning of January to the end of March 1995. Note that the average radon concentration ranged from a high of 6 pCi/L to about 1 pCi/L. The true average over the period was 3.8 pCi/L. That's why a measurement that lasts only a two days can give a false reading of the long term average.
Week to week
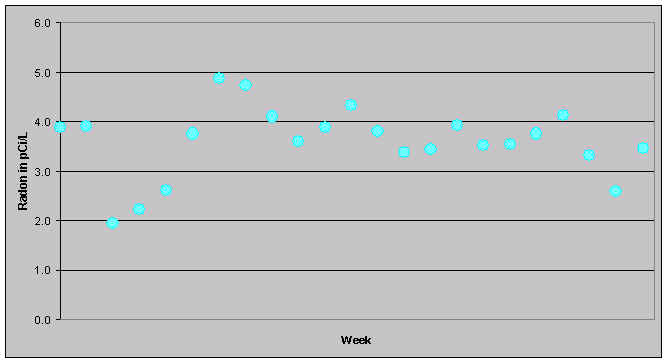
Here is a graph of the average radon in a house for each
weekly period from the beginning of January to the end of March 1995. Note that the
average radon concentration ranged from a high of 5 pCi/L to about 2 pCi/L. The true
average over the period was 3.8 pCi/L. Even a week long measurement can be quite far from
the long-term average.
Month-to-month
Here is a graph of the monthly average radon in a house for the period from the beginning of January 1988 to January 1993. Note that the average radon concentration ranged from a high of 10 pCi/L to less than 1 pCi/L. The true average over the period was 3.5 pCi/L. Even a month-long measurement can be quite far from the long-term average.
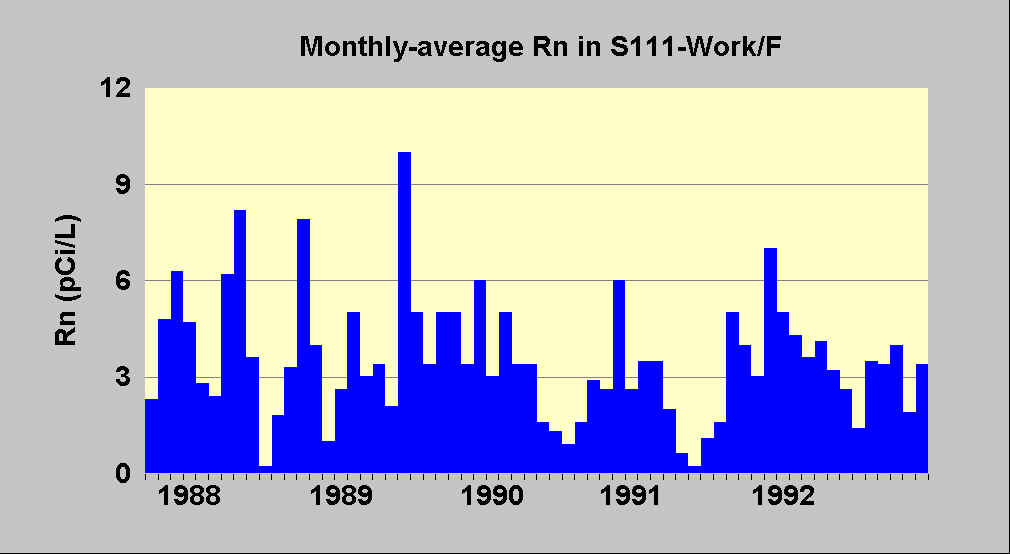
If you analyze this graph for seasonal variation, you will find the highest readings in spring and fall, with summer being the lowest. Spring and fall are seasons of active weather at this site that often requires that the house be closed and heated. heating
Year-to-year
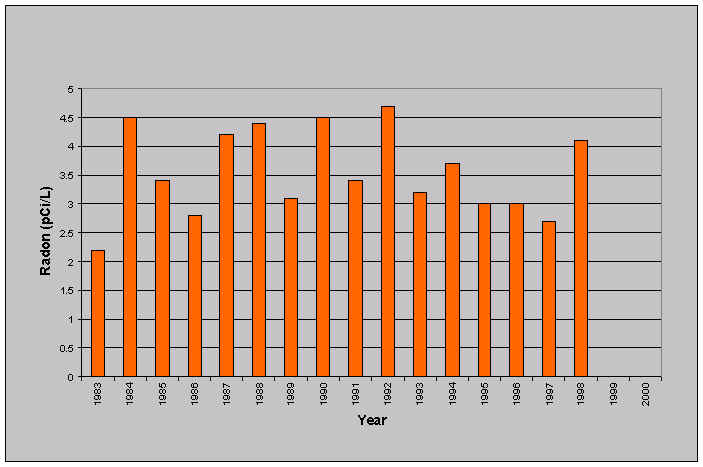
Here is a graph of the annual average radon in a house for each yearly period from the 1983 to 1998. The house was built in 1981 so this is a fairly complete history. Note that the yearly average radon concentration ranged from a high of 4.6 pCi/L to a low of 2.2 pCi/L. The true average over the period was 3.55 pCi/L. In a study of 100 Minnesota homes, I have found that the year-to-year variation in a typical Minnesota house is about 25%. This means that a one year test should be sufficient to decide whether to mitigate or not if you take the view that your lung cancer risk is proportional to the long term radon concentration. However, if you take the current EPA view that there is a sharp "take-action threshold" at 4 pCi/L, you may get a false reading from a single year-long measurement. A 25% variation means that near the current action level of 4 pCi/L, a single year-long measurement might easily yeild any value from 3 pCi/L to 5 pCi/L when the true average is 4pCi/L.

Questions/Comments, e-mail: Dr. Steck
Last revised : 30 June, 2004
Visitor
since
06/30/04
Disclaimer
The views and opinions expressed on the web sites hosted on this server are strictly those
of the author.
The contents of the web sites on this server have not been reviewed or
approved by the College of St. Benedict|St. John's University.