Figure 1 from: Baumgart, T., Hess, S., and Webb, W. "Imaging coexisting fluid domains in biomembrane models coupling curvature and tension." Nature. 425, 821-824 (2003)
Reprinted with permission of Nature, and with permission of the authors.
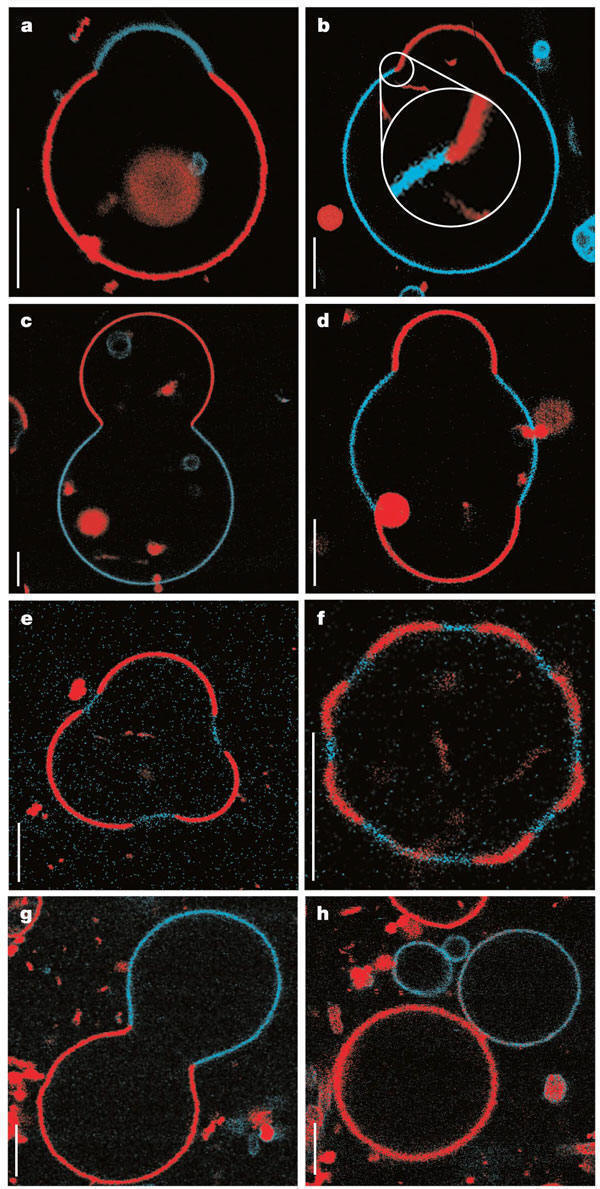
Fluorescence microscopy (two different wavelengths) showing equatorial
sections of GUVs:
Lo phase (blue); Ld phase (red)
Note: junction of Lo and Ld phases are at places of conformational transitions.
1a and b: these show similar shapes even though the domains are reversed, suggesting that the preferential curvature expected for certain lipids is not the driving force for shape.
d -f. cross sectional views show that structures develop that have 2, 3, or more caps. The authors suggests that these may not represent global energy minimum states.
g, h. If the surface to volume ratio is increased (by increasing the temperature or osmotic changes), the caps grow to similar size and separation into two vesicles can occur. The separated vesicles in h have different phase and lipid composition.