Biochemistry Online: An Approach Based on Chemical Logic

CHAPTER 2 - PROTEIN STRUCTURE
E. LABORATORY DETERMINATION OF DGo UNFOLDING
BIOCHEMISTRY - DR. JAKUBOWSKI
02/16/2012
|
Learning Goals/Objectives for Chapter 2E: After class and this reading, students will be able to
|
HOW TO CALCULATE DGO FOR N <=> D FROM PROTEIN DENATURATION CURVES:
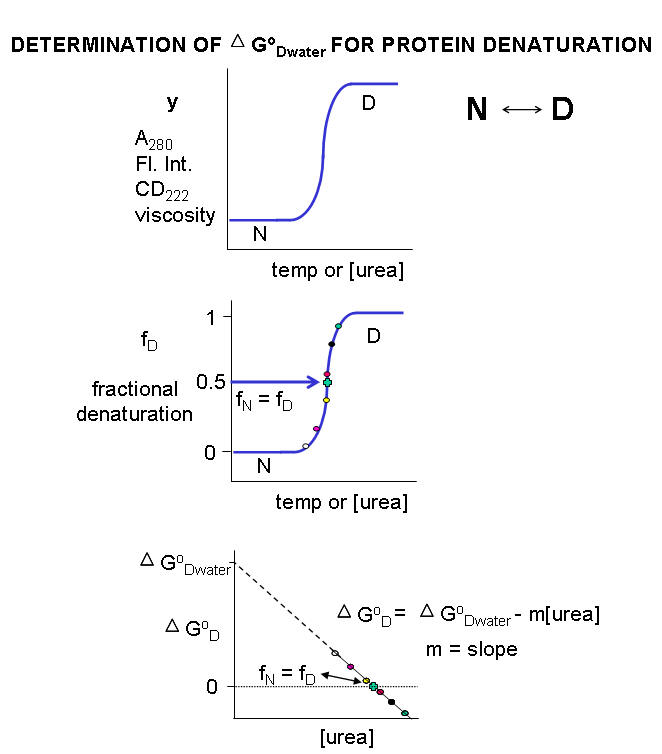
Multiple methods can be used to investigate the denaturation of a protein. These include UV, fluorescence, CD, and viscosity measurement. In all these methods the dependent variable (y) is measured as a function of the independent variable, which is often temperature (for thermal denaturation curves) or denaturant (such as urea, guanidine hydrochloride) concentration. From these curves we would like to calculate the standard free energy of unfolding (DGO) for the protein (for the reaction N <=> D). The denaturation curves usually show a sigmoidal, cooperative transition from the native to the denatured state. The dependent variable can also be normalized to show fractional denaturation (fD). An idealized example of an experimental denaturation curve is shown in the figure below:
Figure: DENATURATION CURVE FOR PROTEINS
A more realistic denaturation curve might show a linear change in the values of the dependent variable (fluorescence intensity for example) for values of temperature or denaturant concentration well below that at which the protein starts to unfold, or above that at which it is unfolded. In these cases, the mathematical analysis, presented below, is a bit more complicated.
For each curve, the value of y (either A280, Fluorescence intensity, viscosity, etc) can be thought of as the sum contributed by the native state and from the denatured state, which are present in different fractional concentrations from 0 - 1. Hence the following equation should be reasonably intuitive.
1. y = fN yN + fD yD where fN is the fraction native and yN is the contribution to the dependent variable y from the native state, and fD is the fraction denatured and yD is the contribution to the dependent variable y from the denatured state. Conservation give equation 2.
2. 1 = fN + fD or fN = 1 - fD. Substituting 2 into 1 gives:
- y = ( 1 - fD) yN + fD yD .
- y = yN - fDyN + fD yD .
- y - yN = fD (yD - yN). Rearranging this equation gives
3. fD = (y - yN) / (yD - yN)
Notice the right hand side of the equations contains variables that are easily measured.
By substituting 2 and 3 into the expression for the equilibrium constant for the reaction N<=> D we get:
Keq = [D]eq/[N]eq = fD/fN or
4. Keq = fD/(1 - fD) and
5. DGo = -RTlnKeq = -RTln[ fD/(1 - fD)]
Remember that DGO (and hence Keq) depends only on the intrinsic stability of the native vs denatured state for a given set of conditions. They vary as a function of temperature and solvent conditions. At low temperature and low urea/guanidine HCl concentration, the native state is favored, and for the N <=> D transition, DGO > 0 (i.e. denaturation is NOT favored). At high temperature and urea/guanidine HCl concentration, the denatured state is favored, and DGO < 0. At some value of temperature or urea/guanidine concentration, both the native and denatured state would be equally favored. At this point, Keq = 1 and DGO = 0. If temperature is the denaturing agent, the temperature at this point is called the melting point (Tm) of the protein, which is analogous to the Tm (in the heat capacity vs temperature graphs) for the gel to liquid crystalline phase transition of phospholipid vesicles.
Figure: gel to liquid crystalline phase transition of phospholipid vesicles
Figure: gel to liquid crystalline phase transition of phospholipid vesicles
Ordinarily, at a temperature much below the Tm for the protein or at a low urea concentration, so little of the protein would be in the D state that it would be extremely difficult to determine the concentration of the protein in the D state. Hence it would be difficult to determine the Keq or DGo for the reaction N <=> D. However, in the range where the protein denatures (either with urea or increasing temperature), it is possible to measure fD/fN.and hence D Go at each urea or temperature.
Denaturation with chemical perturbants (such as urea): Calculation of DGo for N <=>D in the absence of urea
A plot of DGo vs [urea] is linear, and given by the following equation, which should be evident from the beginning figure in this section:
5b. DG0D = DG0D(w/o urea) - m[urea]
Although it is nice to know the Keq and DG0 for the N <=> D transition in the presence of various urea concentrations, it would be even more useful to determine those parameters in the absence of urea, that is, under "physiological conditions". A comparison of the calculated values of DG0 in the absence of urea for a series of similar proteins (such as those varying by a single amino acid prepared by site-specific mutagenesis of the normal or wild-type gene, would indicate how the mutants were stabilized or destabilized compared to the wild-type protein. In experimental cases in which the denaturant is a substance such as urea or guanidine HCl, the DG0D for the protein in the absence of denaturant (i.e in water) can be determined by extrapolating the straight line to [urea] = 0. Admittedly, this is a long extrapolation, but with high quality data and a high correlation coefficient for the linear regression analysis of the best-fit line, reasonable values can be obtained.
Denaturation with heat: Calculation of DHo and DSo for N <=>D at room temperature
Keq values can be calculated from thermal denaturation curves in the same way as described above using urea as a denaturant by monitoring change in an observable (spectra signal for example) vs temperature. Knowing Keq (denoted KD below since at the moment my program won't allow me to change it) and DH0, DS0 can be calculated from equation 8 below as a semi-log plot of lnKeq vs 1/T is a straight line with a slope of - DH0R and a y intercept of + DS0/R.
Hence from Equations (6) and (8) is should be evident that all the major thermodynamics constants (DG0, DH0 and DS0 ) for the N <=> D transition can be calculated from thermal denaturation curves. Equation (9) shows that the derivative of equation (8) with respect to 1/T (i.e. the slope of equation 8 plotted as lnKD vs 1/T) is indeed -DH0/R. Equation (8) is the van't Hoff equation, and the calculated value of the enthalpy change is termed the van't Hoff enthalpy, DH0vHoff. Equation (10) calculates the derivative of lnKeq with respect to T instead of 1/T. This method assumes that the denaturation is cooperative (no intermediates) and that DH0 is independent of temperature over the narrow range of temperature in which the protein cooperatively unfolds.
This equation will be useful later when we compare the enthalpies calculated using the van't Hoff equation with those determined directly using differential scanning calorimetry by analyzing a plot of Cp vs T. (Note that the area under the Cp vs T curve as the protein transitions to the unfolded state has units of kcal. The DH0 for the unfolding is inversely proportional to the width of the curve.) .
In contrast to the long extrapolation of the DG0 vs [urea] to [urea] = 0 to get DG0 (the y intercept) in the absence of urea, which has some physical meaning, extrapolation of the straight line from the van't Hoff plot from equation 8 to get DS0/R, the y intercept, has little meaning since the 1/T value at the y intercept is 0, which occurs when T approaches infinity. DS0 can be calculated at any reasonable temperature from the the calculated value of DG0 at that temperature and the calculated DH0vHoff.

Biochemistry Online by Henry Jakubowski is licensed under a Creative Commons Attribution-NonCommercial 4.0 International License.