Biochemistry Online: An Approach Based on Chemical Logic

CHAPTER 6 - TRANSPORT AND KINETICS
D. MORE COMPLICATED ENZYMES
BIOCHEMISTRY - DR. JAKUBOWSKI
Last Update: 04/11/16
|
Learning Goals/Objectives for Chapter 6D: After class and this reading, students will be able to
|
D1. Multi-Substrate Enzymes
In reality, many enzymes have more than one substrate (A, B) and more than one product (P, Q). For example, the enzyme alcohol dehydrogenase catalyzes the oxidation of ethanol with NAD (a biological oxidizing agent) to form acetaldehyde and NADH. How do you do enzymes kinetics on these more complicated systems? The answer is fairly straightforward. You keep one of the substrates (B, for example) fixed, and vary the other substrate (A) and obtain a series of hyperbolic plots of vo vs A at different fixed B concentrations. This would give a series of linear 1/v vs 1/A double-reciprocal plots (Lineweaver-Burk plots) as well. The pattern of Lineweaver-Burk plots depends on how the reactants and products interact with the enzyme.
Sequential Mechanism: In this mechanism, both substrates must bind to the enzyme before any products are made and released. The substrates might bind to the enzyme in a random fashion (A first then B or vice-versa) or in an ordered fashion (A first followed by B). An abbreviated notation scheme developed by W.W. Cleland is shown below for the sequential random and sequential ordered mechanisms. For both mechanisms, Lineweaver-Burk plots at varying A and different fixed values of B give a series of intersecting lines. Derivative curves can be solved to obtain appropriate kinetic constants.
D2. Ping-Pong Mechanism
In this mechanism, one substrate binds first to the enzyme followed by product P release. Typically, product P is a fragment of the original substrate A. The rest of the substrate is covalently attached to the enzyme E , which is designated as E'. Now the second reactant, B, binds and reacts with the E' and forms a covalent bond to the fragment of A still attached to the enzyme, forming product Q. This is now released and the enzyme is restored to its initial form, E. This represents a ping-pong mechanism An abbreviated notation scheme is shown below for ping-pong mechanisms. For this mechanism, Lineweaver-Burk plots at varying A and different fixed values of B give a series of parallel lines. One example of a ping-pong enzyme is low molecular weight protein tyrosine phosphatase. It reacts with the small substrate p-initrophenylphosphate (A) which binds to the enzyme covalently with the expulsion of the product P, the p-nitrophenol leaving group. Water (B) then comes in and covalently attacks the enzyme, forming an adduct with the covalently bound phosphate releasing it as inorganic phosphate. In this particular example, however, you can't vary the water concentration and it would be impossible to generate the parallel Lineweaver-Burk plots characteristic of ping-pong kinetics.
What are the meanings of the kinetic parameters, Km and Vm, for multisubstrate/multiproduct mechanisms? Consider a random sequential bi-bi reaction for a "simple" case in which the rapid equilibrium assumption defines the binding of substrates A and B.
By inspection, there would appear to be two types of "effective" dissociation constants for reactant A. One describes the binding of A to E (Kia) and the other the binding of A to EB (Ka). Using mass balance for E and relationship that v0=kcat[EAB], the following initial rate equation can be derived.
Note that Kib does not appear in the final equation. How can that be? The answer lies in the fact that the final concentration of EAB can be derived from the path E to EA to EAB or from the path E to EB to EAB. Assuming rapid equilibrium, KiaKb=KibKa.
The following equation can be derived from ping-pong bi-bi mechanism.
For simplicity, all of the enzyme kinetic equations have been derived assuming no products are present.
D3. Inhibitors in Multi-substrate Reactions:
Product Inhibition: Interpretation of kinetic experiments can be complicated by the fact that the reactions can be reversed. Even if the catalytic conversions of the reverse steps have too high an activation energy to actual proceed, the products, which obviously have some structural resemblance to the reactants could inhibit the enzyme as they could compete with reactants for binding to the enzyme. In contrast to studying enzyme inhibition using varying concentrations of substrate at different fixed concentrations of inhibitor, the concentration of products produced by an enzyme are constantly increasing over the time course of the reaction. This suggests one immediate reason that most kinetic parameters are determined by initial rate methods in which the inhibitor-product has not yet build to a sufficient concentration to alter the rate of conversion of substrate to product. Product inhibition can occur in single substrate reactions as well.
Dead End Inhibition: How do added inhibitors affect the double reciprocal plots of multisubstrate reactions? Let's consider a special case of inhibitors call dead-end inhibitors. These reversible inhibitors bind to a form of the enzyme and inhibit product formation but do not participate in the reaction. It would be represented on a Cleland diagram as a vertical line coming off the the horizontal line which represent different enzymes forms (E, EA, EAB, E'Q, EP, EQ, etc) that lead to product formation. A quick inspection of Cleland diagrams lead to two simple rules that helps in the interpretation of double reciprocal plots in the presence of different fixed and nonsaturating concentrations of dead-end inhibitors (I) in multisubstrate reactions (when one substrate S is varied):
-
Slope changes when:
-
I and S bind to the same form of the enzyme (for example E binds both S and I) OR
-
I binds to a form of E (on the horizontal line) which is connected to the form that S binds, and I binds first (for example, I binds to E and then S binds).
-
Y Intercept changes when:
-
I and S bind to different forms of the enzyme unless I binds first and the binding of I and S are in rapid equilibrium.
The rules predict 1/v vs 1/S plots for simple competitive inhibition (S and I bind to the same enzyme form, E) and uncompetitive (S binds to E followed by binding of I to ES). If the slope changes and the y intercept doesn't, that's competitive inhibition. If the y intercept changes and the slope remains constant, that is uncompetitive inhibition. It works also for mixed inhibition where I binds to E (the same form as S binds to), which changes the slope, AND also binds to EA (a different form of the enzyme than S binds to which is E), which changes the y intercept.
These same rules apply for product inhibition. Consider the rapid equilibrium ordered bibi reaction above when the concentration of the other substrate is around its Kx value:
-
Ia (an inhibitor that resembles A) and A both bind to E and EB, so the inhibition is competitive as the slope changes but not the Y intercept
-
Ia and B both bind to the same enzyme form (E) so the slope should change, but Ia also binds to EB (to which B can not bind) so the Y intercept would change, which when combined would give either uncompetitive or noncompetitive.
D4. Allosteric Enzymes
Many enzymes do not demonstrate hyperbolic saturation kinetics, or typical Michaelis-Menten kinetics. Graphs of initial velocity vs substrate demonstrate sigmoidal dependency of v on S, much as we discussed with hemoglobin binding of dioxygen. Enzymes that display this non Michaelis-Menten behavior have common characteristics. They :
- are multi-subunit
- bind other ligands at sites other than the active site (allosteric sites)
- can be either activated or inhibited by allosteric ligands
- exist in two major conformational states, R and T
- often control key reactions in major pathways, which must be regulated.
A classic examples of allosterically regulated enzymes includes glycogen phosphorylase which breaks down intracellular glycogen reserves.

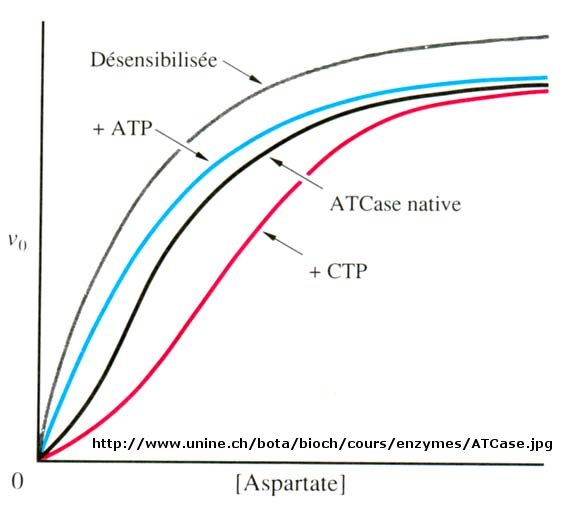
Another is aspartate transcarbamyolase, which catalyzes the first step in the synthesis of pyrimidine nucleotides. CTP is an allosteric inhibitor of this enzyme, which makes physiological sense since high levels of this pyrimidine nucleotide should inhibit the first enzyme in the synthesis of pyrimidines. ATP is a allosteric activator. This also makes sense since if high levels of the purine nucleotide ATP are present, one would also want to balance the level of pyrimidine nucleotides.
Figure: Aspartate transcarbamoylase: reactions
Figure: Aspartate transcarbamoylase: Non Michaelis-Menten Kinetics
Earlier we saw that cooperative binding equilibrium could be modeled with the Hill Equation, which we introduced through the equation Y = Ln/(Kd + Ln) = Ln/(P50n + Ln) where n is the cooperativity or Hill Coefficient. Likewise, for an enzyme which demonstrates cooperative (sigmoidal) initial rates plots,
vo = VmSn/K0.50n + Ln)
When n=1, the equation reduces to the classical hyperbolic Michaelis Menten equation. For values of n>1, sigmoidal plots are observed. We found a more easily understandable molecular interpretation of cooperative binding of oxygen to hemoglobin using the MWC model (T and R states). The MWC model has also been applied successfully to multi-subunit enzymes which display cooperative, sigmoidal kinetics. In this model, allosteric inhibitors (which often don't resemble the substrate) bind preferentially to the T state, leading to lower activity, while allosteric activators bind preferentially to the R state, leading to greater activity. Activators shift the vo vs S curve to the left while inhibitors shift it to the right (much like protons and carbon dioxide in hemoglobin binding). These allosteric ligands induce their effects by shifting the To <=> Ro equilibrium.
How do allosteric effectors change Vm and Km?
We have just studied how competitive, uncompetitive, and noncompetitive (or mixed) inhibitors influence the apparent Km and Vm values for enzymes that display Michaelis-Menten kinetics. How are Vm and Km influenced in allosteric enzymes? The example given above (ATCase), analogous to effects observed in hemoglobin:oxgyen binding, influence the apparent Km, but not the Vm. Remember that in the case of hemoglobin binding curves, the allosteric activators and effectors we discussed shifted the sigmoidal binding curves to the left or right, but all reached a plateau at the same fractional saturation value of 1. Allosteric enzyme systems that behave like this are called K systems. Enzymes in which allosteric regulators change Vm, called V systems, are also known. V systems display hyperbolic vo vs S curves in which activators display a greater apparent Vm and inhibitors display a lower Vm without affecting the apparent Km. In these systems, both the T and R forms have the same affinity for substrate (hence the same apparent Km). This would be analogous to a situation in the MWC model where KR/KT =1 which also gave hyperbolic, not sigmoidal Y vs α curves. This difference in V systems is that the R and T states have different catalytic rate constants, kcat, for turnover of the bound substrate (hence different apparent Vm values). In addition, the activator A and inhibitor I bind to the R and T forms with different affinity, which again shifts the To <=> Ro equilibrium in the presence of the allosteric effectors.
Cooperative binding of dioxygen to hemoglobin, regulated by allosteric effectors (protons and carbon dioxide), was ideal for an oxygen transport system which must load and unload oxygen over a narrow range of oxygen concentrations and allosteric effectors. Allosteric enzymes are usually positioned at key metabolic steps which can be regulated to activate or inhibit whole pathways.
Enzyme Regulation by Covalent Modification
Many enzymes are regulated not by allosteric ligands (activators and inhibitors), but by covalent modification. Often the covalent modification involves phosphorylation (by enzymes called kinases which transfer a phosphate from ATP to a Ser, Thr, or Tyr on the target enzyme) or phosphatases (which remove the phosphates from phospho-Ser, Thr, or Tyr in the target protein). In fact 1-2% of all genes in the human genome code for kinases and phosphatases.
D5. Integration of Binding, Facilitated Diffusion and Kinetics
By now you should realize the similarities among the chemical and mathematical equations used to describe binding, facilitated diffusion, and enzyme kinetics of macromolecule interactions with ligands and substrates. In simple, noncooperative systems, it all starts with a macromolecule, usually a protein, binding a ligand, which can be a small molecule or another macromolecule.
M + L <=> ML
In some cases, the only function of M is to bind and release ligand (as in the case of myoglobin). In other cases, the ligand is transformed. In the simplest case involving transformation, the ligand is moved across a membrane down a concentration gradient (facilitated diffusion), a purely physical step.
R + Aout <=> RA --> R + Ain
In a yet more complicated case, the ligand can be transformed chemically (enzyme kinetics) into product.
E + S <==> ES --> E + P
In this chapter we added interactions (multiple substrates, inhibitors) and saw that the basic form of the binding, facilitated diffusion, and enzyme kinetic equations and graphs for noncooperative system were extremely similar since the biological function always depended in some fashion on the concentration of the macromolecule complex ( ML, RA, ES, EI, ESI etc). The PowerPoint below reviews the similarity in the results of the mathematical analyses and resulting graphs showing the concentration dependencies of complex formation, facilitated diffusion, and enzyme-catalyzed chemical reactions.
-
PowerPoint: Summary of Graphical Descriptions of Noncooperative Binding, Facilitated Diffusion, and Enzyme Kinetics
A feel for the dissociation constant
In all of the curves shown in the above PowerPoint, a ligand concentration can be found at which the biological effect is half maximum (either activation or inhibition of a biological function). Remember, only in certain conditions is that number equal to the dissociation constant for ligand. This is clearly the case when the only interaction is a 1:1 binding of a macromolecule and ligand. If an inhibitor was unknowingly present during the direct or indirect measurement of a binding reaction, the ligand concentration at half-maximal binding would equal the apparent Kd, not the actual dissociation constant. In the case of facilitated diffusion and enzyme-catalyzed chemical transformation of a single substrate, the ligand concentration at half-maximal binding is equal to the dissociation constant only in the rapid equilibrium assumption holds. It clearly doesn't in the steady state assumption, and clearly not in more complicated systems. Consider the case when a ligand binds a neurotransmitter receptor and alters intracellular the calcium ion concentration through a complicated signal transduction system. If the step leading to the releases of stored intracellular calcium is several steps removed from the actual binding of ligand to a neurotransmitter receptor, the likelihood that the ligand concentration at half-maximal increase in intracellular calcium is equal to the Kd for ligand binding is small. If however, the actual ligand dissociation constant for the receptor can be determined (using radiolabeled ligand, for example), and it is equal to the ligand concentration for half-maximal calcium increase, then it might be argued the binding is "rate or effect determining". When inhibitors of biological function are used, IC50 values (the inhibitor concentration at which the response is reduced to 50%) are usually reported.
From the Simple to the Complex
Enzymes don't work in isolation. Most are part of complex synthetic/degradative or signal transduction systems in which their biological response (product formation or degradation, pathway regulation, etc.) are functions of ligand concentration and are subject to signals further upstream or downstream in their resident pathways. How are the dose responses for biological activity modulated by other parts of the pathway? Although the equations we've derived don't directly predict the responses in lieu of knowing the concentrations, rate constants, and dissociation constants for all the steps in the pathway, an approach based on simple assumptions might illuminate the possibilities. A recent paper by Bashor et al and an analysis of it by Pryciak describe the input and output responses of signaling enzymes attached "in series" to a scaffold protein and how different dose responses outputs can be engineered to meet the requirements of the pathway. Examples of different dose-response curves from Bashor analysis are shown below. We've actually seen many of these response curves for individual protein/enzymes or chemical reaction systems. Curve A represents a typical response curve which could be produced by a process governed by a simple M + L <=> ML equilibrium. Curves B and C are sigmoidal and could be produced by a process governed by a multisubunit enzyme following the MWC model with different values for the parameters L and c. Curve D is similar to the output of consecutive irreversible reactions such as A --> B --> C, where the response would be similar to the rise and fall B with time (not concentration, however). One could envision a dose/response, however, that could produce a rise/fall as in curve D. Likewise Curve E would reflect the rise of C in the same chemical reaction. To a first approximation, one could image that the responses shown below are produced by steps that are rate-limiting in the overall pathway such that the overall response is governed by those steps. Obviously a complex mathematical systems analysis involving the solving of matrices of differential equations for each step would be required for a more realistic understanding of actual biological responses, but I hope you can see that an understanding of real biological networks must start with a kinetic and thermodynamic understanding of the "simple" steps that constitute larger system pathways.
References
- Pryciak, P. Customized Signaling Circuits. Science 319, pg 1489 (2008)
- Bashor, C. Science 319, pg 1539 (2008)

Biochemistry Online by Henry Jakubowski is licensed under a Creative Commons Attribution-NonCommercial 4.0 International License.