Reactivity in Chemistry
Reduction & Oxidation Reactions
RO11. Cyclic Voltammetry
Cyclic voltammetry is a commonly used method of measuring the reduction potential of a species in solution. The species may be a coordination complex or a redox-active organic compound, for example. Cyclic voltammetry provides additional data that can be interpreted to make conclusions about the reduction / oxidation reaction and the stability of the species resulting from the electron transfer.
In cyclic voltammetry, rather than measuring the voltage produced by a reaction as we discussed before, a voltage is instead applied to the solution. The voltage is changed over time and current through a circuit is monitored. When the voltage reaches a point at which a reduction/oxidation is induced, current begins to flow. A cyclic voltammogram is a plot of current versus applied voltage.
In the experiment, the species of interest is dissolved along with some electrolyte, which promotes conductivity in the solution. Three electrodes are inserted into the solution. The working electrode, where the reduction / oxidation reaction takes place, is mostly covered with an insulator, but has a small disc of electrode exposed so the reaction can take place in a carefully controlled area. The counter electrode completes the circuit. A reference electrode with a known potential is also used in order to measure the potential applied to the cell. Unusually, the solution must not be stirred.
To begin the experiment, a potential is applied that is much more positive than the potential of the reference electrode. This step ensures that the species of interest is completely oxidized to begin with. The voltage is then swept in the negative direction at a constant rate. That is, the potential at the working electrode gets lower and lower, possibly until it becomes negative compared to the reference electrode. At some point, the voltage sweep is reversed, and it becomes more and more positive until it returns to the initial setting.
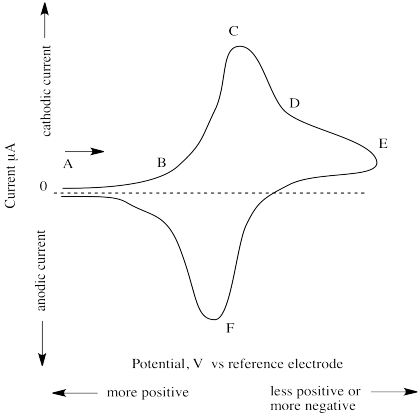
The (simulated) results of such an experiment are shown below.
Figure RO11.1. A simulated (just a sketch in this case) cyclic voltammogram.
At point A, the potential is very positive but is then swept to lower and lower values. At point B, current begins to flow as the voltage reaches a point that allows reduction to occur. Current keeps increasing until, at point C, all of the species in the vicinity of the working electrode has already been reduced. This point is called "cathodic peak potential". Current then begins to decrease, although some still keeps flowing as more of the species slowly diffuses over to the working electrode (point D).
The reasons for two of the features of the experimental design are now apparent. The reason for the very small exposed surface of the working electrode (usuallyan exposed disc about 1 mm wide) is to limit the area in which reaction takes place, so that we can observe when a controlled population of species has been reduced. The reason for not stirring the solution is similar; if we stirred the solution, more species would be continually and quickly fed to the working electrode and we would never observe a point at which the reaction was "finished".
At some point, the potential is increased again (point E). Current keeps decreasing; that trend is reversed as the previously reduced species is again oxidized. This time, current flows in the opposite direction, and a negative peak is observed. At point F, all of the species in the vicinity of the working electrrode has been oxidized, and current begins to "drop" again. This point is called "anodic peak potential". The "formal potential" is the mean of anodic and cathodic peak potential.
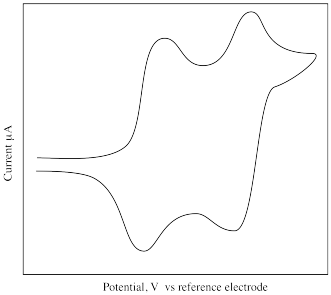
Problem RO11.1.
What is different about the following cyclic voltammogram compared to the previous one? Explain what is happening in this sample.
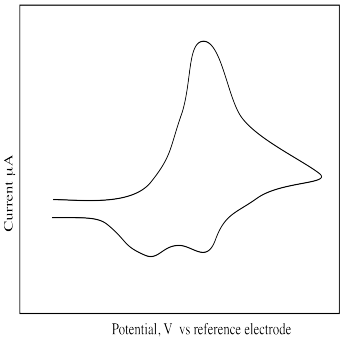
Problem RO11.2.
What is different about the following cyclic voltammogram? Explain what is happening in this sample.
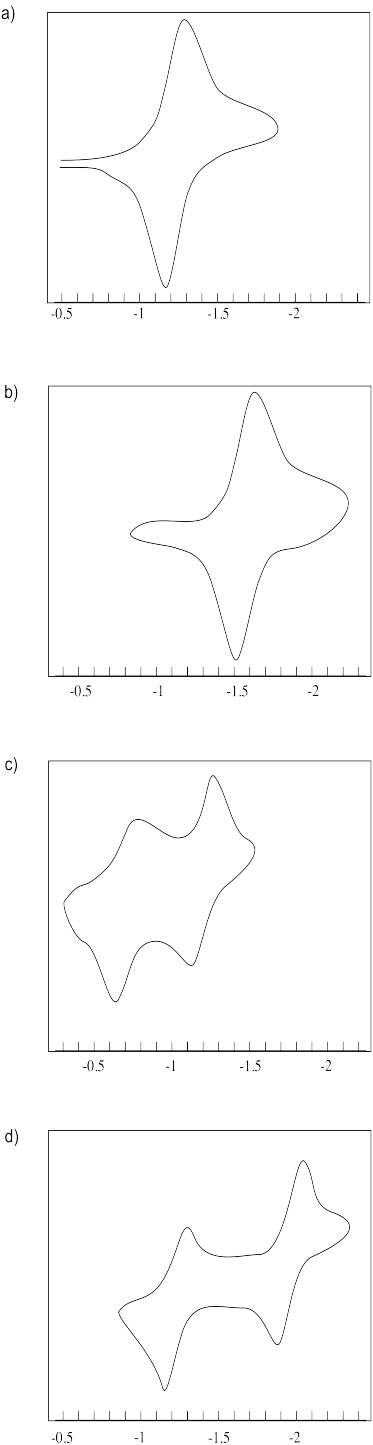
Problem RO11.3.
Estimate the reduction potentials in the following cyclic voltamograms.
All cyclic voltamograms courtesy of Virtual Imagination / Slapdash Chemistry Products, Inc.
This site was written by Chris P. Schaller, Ph.D., College of Saint Benedict / Saint John's University (retired) with other authors as noted on individual pages. It is freely available for educational use.

Structure & Reactivity in Organic,
Biological and Inorganic Chemistry by
Chris Schaller
is licensed under a
Creative Commons Attribution-NonCommercial 3.0 Unported License.
Send corrections to cschaller@csbsju.edu
This material is based upon work supported by the National Science Foundation under Grant No. 1043566.
Any opinions, findings, and conclusions or recommendations expressed in this material are those of the author(s) and do not necessarily reflect the views of the National Science Foundation.
Navigation: