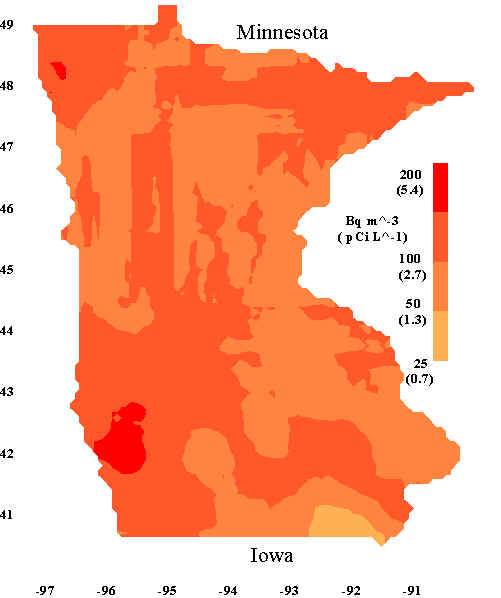
This contour map was based on annual average radon concentrations measured
using alpha track detectors indoors in Minnesota and Iowa. The spatial coverage was
reasonably uniform in Iowa (111 sites). In Minnesota half of the 64 sites were located in
the southwest corner of the state and the most of the rest were in the northwest. See one
of the Minnesota ATD maps for better coverage of Minnesota homes. US radon concentration
units are given in parentheses underneath the international units on the color scale bar.
The color code is coordinated with the outdoor radon map below. Experimental details are
avaiable in:
D. J.
Steck, R. W. Field, and C. F. Lynch ; “Exposure to Atmospheric
Radon”, Environmental Health Perspectives ; 107 (2),123-127; 1999

Questions/Comments, e-mail: Dr. Steck
Last revised : 30 June, 2004
Visitor
since
06/30/04
Disclaimer
The views and opinions expressed on the web sites hosted on this server are strictly those
of the author.
The contents of the web sites on this server have not been reviewed or
approved by the College of St. Benedict|St. John's University.