Cut Site Selection by the Two Nuclease Domains of the Cas9 RNA-guided Endonuclease. Hongfan Chen, Jihoon Choi and Scott Bailey.The Journal of Biological Chemistry, 289, 13284-13294 (2014)
5. To determine the effect of PAM sequence and linker length on binding of LMG18311 Cas9 to DNA targets, the authors determined the binding affinity (Kd) of the Cas9-sgRNA complex to 5′ end-labeled dsDNA targets using native gel electrophoresis.
a. Why did they not include SDS in the gel?
Answer: SDS is a powerful denaturant and would have denatured Cas9 and separated the complex.
b. Binding experiments were conducted with the nuclease-deficient mutant of Cas9 (D9A,H599A) in the presence of Mg2+. Fixed concentrations of the dsDNA targets were incubated with increasing concentrations of the Cas9-sgRNA complex. Why did they use the double mutant of Cas9?
Answer: to prevent the enzyme from cleaving the target DNA which would prevent detection of the complex.
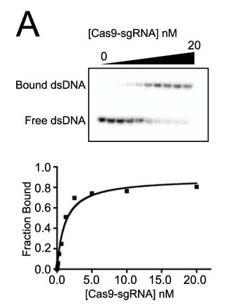
c. Figure A below shows a representative gel shift assay for Cas9-sgRNA and the binding curve measured from the assay. From inspection of the graph, what is the approximate Kd for the interaction? The top wedge indicates increasing concentration of the Cas9-sgRNA.
Answer: approximately 2 nM Cas9-sgRNA (the ligand concentration at half maximal binding of the curve is truly a hyperbola.
b. A bar graph plotting Kd values for DNA targets with PAM mutations (labeled red) are shown below (B) . Average values from at least three replicates are shown, with error bars representing 1 S.D. Targets where binding was not observed are shown with Kd values at the lower limit (> 1000 nm). PS denotes the protospacer sequence. Interpret the results.
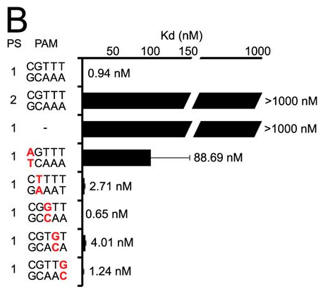
Answer: A target containing a complementary protospacer, a 2-bp linker, and a functional PAM bound to Cas9-sgRNA with an affinity of 0.94 ± 0.27 nm. The investigators were unable to detect binding to a target containing a noncomplementary protospacer or to a target that lacked a PAM. Mutation of the guanosine at position 1 of the PAM resulted in an about 100-fold increase in Kd, whereas mutations at positions 2 through 5 did not significantly alter the affinity (all within about 4-fold on the consensus PAM).
c. Next they investigated linker length and binding. Figure C shows a bar graph plotting Kd values for DNA targets with different linker lengths (labeled red) (C). Average values from at least three replicates are shown, with error bars representing 1 S.D. Targets where binding was not observed are shown with Kd values at the lower limit (> 1000 nm). PS denotes the protospacer sequence. Interpret the results.
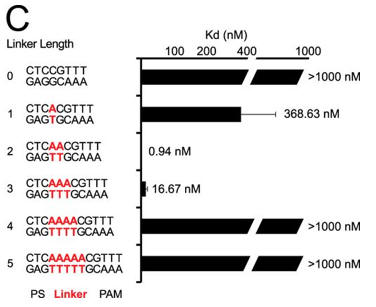
Answer: Changes in linker length had a larger effect on binding affinity. Under the conditions tested, we failed to detect binding to plasmid targets containing linker lengths of 0, 4, or 5 bp (Kd > 1000 nm), whereas linkers of 1 and 3 bp reduced the affinity by about 400- and about 20-fold, respectively.
Navigation:

