Thermodynamics of the GTP-GDP-operated Conformational Switch of Selenocysteine-specific Translation Factor SelB. Alena Paleskava, Andrey L. Konevega and Marina V. Rodnina . The Journal of Biological Chemistry, 287, 27906-27912 (2012). doi: 10.1074/jbc.M112.366120 .
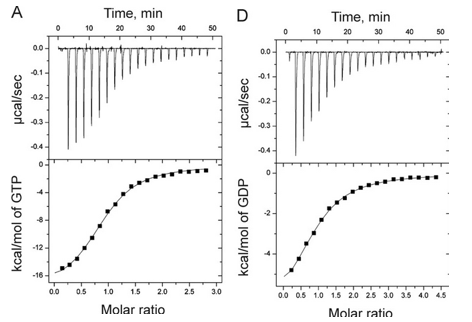
1. Answer the following questions based on the ITC thermograms for binding of GTP to SelB (A) and GDP to SelB (B) below.

a. The titration curves above appear sigmoidal in contrast to the hyperbolic saturation binding curve you drew for a simple M + L binding equilibrium. Sigmoidal ML vs L binding plots are often associated with cooperative binding interactions. Why are these plots NOT hyperbolic even they the enthalpy changes can be best modeled by a simple, non-cooperative binding of M and L with a stoichiometry of 1?
Answer: The bottom plots above shown signal change (enthalpy change) as a function of molar ratio, NOT free ligand. Using the Kd derived from the theoretical fit, and the actual total concentrations of SelB and GXP, the amount of ML and free GXP could be calculated. A plot of enthalpy change vs free GXP would be hyperbolic.
b. Is the binding exothermic or endothermic? What is the sign of DH?
Answer: exothermic; negative
b. Which one proceeds with a lower dissociation constant (Kd)?
Answer: The binding of GTP since at a 1:1 molar ratio of SelB and GTP, the signal (enthalpy) change is half its maximal change, indicating a high concentration of SelB:GTP complex than see in B.
c. Assuming that the binding is favored, which one has a more negative DG0? Assume equal concentrations of SelB in the sample cell. Which one is more favored under standard condition?
Answer: The binding of GTP as the higher the Keq, the lower the Kd, the more negative the DG0.
d. The change in Gibbs Free energy is also related to the change in enthalpy and entropy as shown in the equation below:

Can you deduce from simple inspection of the curves above if DS0 is <, =, or >? Explain.
Answer: Since binding occurs under the experimental conditions, lets assume Keq > 1 and Kd < 1 (although this might not be true if the concentrations of SelB and GXP were suffiiciently high enough in the experiment to overcome a Keq < 1). Hence DG0 <0. Since binding is exothermic, DH0 < 0. That implies that -TDS0 could either be negative (so DS0 is positive) or that TDS0 is positive (so DS0 is negative) but not positive enough to make the reaction disfavored.
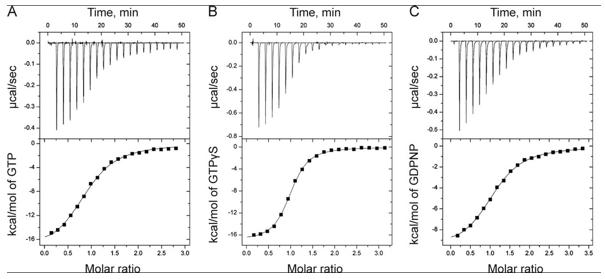
The ITC thermograms comparing the binding of GTP (A) and two analogs of GTP, GTPγS (B), GDPNP (C), are shown below

d. Again assuming similar concentration of SelB in the sample C, compare the Kds for the interaction of GTPγS and GDPN to SelB.
Answer: The reaction of GTPγS has progressed to a greater degree at a 1:1 stoichiometery than that of GDPN to SelB. Hence GTPγS has a lower Kd for binding SelB.
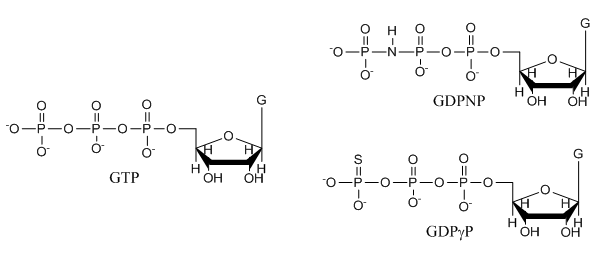
e. The structures of GTP and the two analogs are shown below. Suggests a reason that the investigators used the analogs in their studies.

Answer: These are likely to undergo hydrolysis at the gamma P which is import as they study a protein that can bind either GTP or GDP and that has GTPase activity. The S in the GTPγS analog is less electronegative than O and hence less likely to pull pi bonded electrons in the double bond toward in the developing transition state to form an oxyanion pentavalent intermediate. Likewise, the P-N bond in the other analog is less likely to be cleaved as the leaving group with a negative charge on the less electronegative N is less stable.
f. The ITC thermograms be fit to a theoretical model for M and L binding with a stoichiometry of one. From this data fit, Kd can be determined. How would you calculate the DS0 for the interaction of SelB and GXP?
Answer: If you know Kd, you can determine DG0 since it equals -RTlnKeq = RTlnKd. You can determine DH0 directly from the experiment. Hence you can obtain DS0 from the equation DG0 = DH0 -TDS0 .
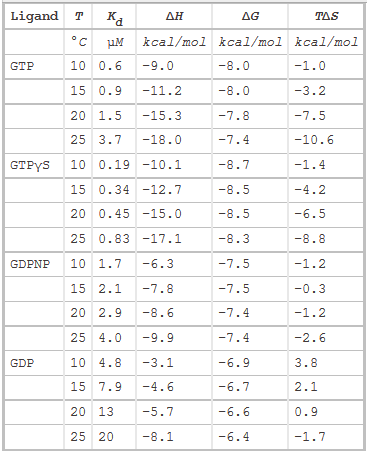
The thermodynamic parameters of SelB binding to guanine nucleotides at different temperatures are shown below.

g. Do they confirm your answers to b and d above?
Yes