Biochemistry Online: An Approach Based on Chemical Logic

CHAPTER 5 - BINDING
C: MODEL BINDING SYSTEMS
BIOCHEMISTRY - DR. JAKUBOWSKI
3/29/16
|
Learning Goals/Objectives for Chapter 5C: After class and this reading, students will be able to
|
C1. Myoglobin, Hemoglobin, and their Ligands
Almost all biochemistry textbooks start their description of the biological functions of proteins using the myoglobin and hemoglobin as exemplars. These are very rational approaches since they have become model systems to describe the binding of simple ligands, like dioxygen (O2), CO2, and H+, and how the structure of the protein determines and is influenced by binding of ligands.
Yet in a way these "ligands" are dissimilar to perhaps the majority of other proteins which bind small ligands such as substrates (for enzymes), inhibitors and activators or large "ligands" such as other proteins, nucleic acids, carbohydrates and lipids. These type of ligands are reversibly bound through classical intermolecular forces (IMFs), such as hydrogen bonds, London dispersion forces, dipole-dipole interactions, and ion-ion interactions. In addition to these are the less commonly discussed pi-pi (aromatic) interactions and cation-pi (aromatic) interactions.
![]() YouTube: Less Common Discussed IMFs -
pi-pi, cation-pi
interactions, and halogen bnding
YouTube: Less Common Discussed IMFs -
pi-pi, cation-pi
interactions, and halogen bnding
The classic ligands that reversibly bind to hemoglobin, dioxygen, carbon dioxide, and protons, are bound covalently. Dioxygen binds to a heme Fe2+, protons obviously bind to proton acceptors (like His), while CO2 binds covalently as if forms a carbamate with the N terminus of one of the hemoglobin chains.
This discrepancy in ligand binding mode can be explained easily for dioxygen as it forms a coordinate or dative covalent bond with the transition metal ion Fe+2. In ordinary covalent bonds, each bonded atom contributes to and shares the two electron in the bond. In coordinate or dative covalent bonds, the ligand, a Lewis base, contributes both electrons in the bond. Both electrons are still considered to be "owned" by the ligand and not by the transition metal ion, a Lewis acid. Hence the ligand can readily dissociate from the metal ion, much as a ligand bound through classical IMFs can. This analogy can be extended to protons which are also Lewis acids (with no contributing electrons) as they react with Lewis bases (lone pair donors) on atoms such as N on a His side chain.
Mb (a monomer containing 8 α−helices, A-H) and Hb (a heterotetramer with two α -and two β−subunits, each which also contains 8 α−helices) are both oxygen binding proteins. Dioxygen is transported from lungs, gills, or skin of an animal to capillaries, where it can be delivered to respiring tissue. It has a low solubility in blood (0.1 mM). Whole blood, which contains 150 g Hb/L, can carry up to 10 mM dioxygen. Invertebrate can have alternative proteins for oxygen binding, including hemocyanin, which contains Cu and hemerythrin, a non-heme protein. On binding dioxygen, solutions of Hb change color to bright red. Solutions of hemocyanin and hemerythrin change to blue and burgundy colored, respectively, on binding dioxygen. Some Antarctic fish don't require Hb since dioxygen is more soluble at low temperature. Mb is found in the muscle, and serves as a storage protein for oxygen transported by Hb. Some information about the proteins is given below:
Hemoglobin:
- 1st. protein whose molecular weight was determined
- 1st protein to be assigned a specific function - dioxygen transport
- has a prosthetic group (non-amino acid) heme group (protoporphyrin IX with a ferrous ion) covalently attached to the protein. The heme group binds dioxygen.
- 1st protein in which a point mutation (single base pair charge) causes a single amino acid change in the protein, marking the start of molecular medicine
- 1st protein with high resolution x-ray structure
- theory for dioxygen binding explain control of enzyme activity
- the binding of dioxygen is regulated by binding of H+, CO2, and bisphosphoglcyerate which bind to sites (allosteric) distant from oxygen binding site.
- crystals of deoxy-Hb shatter on binding dioxygen, indicating significant conformational changes on binding.
Heme group:
Figure: Heme
- The heme group contains protoporphyrin IX, with four tetrapyrrole rings linked by methene bridges. Attached to the tetrapyrrole structure are four methyl, two vinyl, and two proprionate groups. These can be arranged in 15 ways, only one (IX) occurs in biological systems. Ferrous ion bonded to the protoporphyrin IX constitutes the heme group.
- The heme fits into a hydophobic crevice in the proteins with the proprionate groups exposed to solvent.
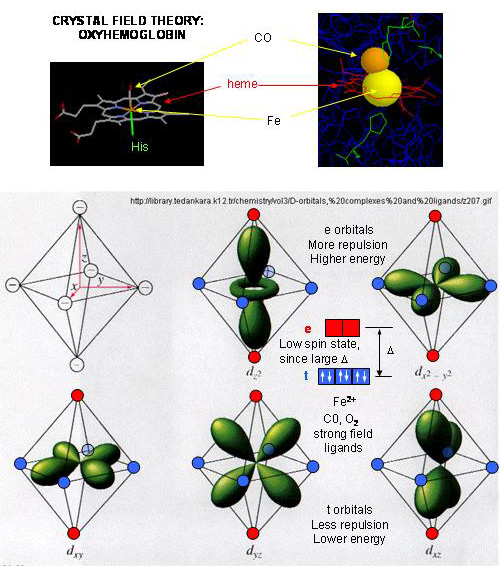
- The Fe2+ ion is coordinated to 4 N's on the 4 pyrrole rings, The 5th ligand is a supplied by proximal His (the 8th amino acid on helix F) of the protein. In the absence of dioxygen, the 6 ligand is missing. and the geometry of the complex is square pyramidal with the Fe above the plane of the heme ring. A distal His (E7) is on the opposite side of the heme ring, but too far to coordinate with the Fe. When dioxgen binds, it occupies the 6th coordination site and pulls the Fe into the plane of the ring, leading to octahedral geometry. CO, NO, and H2S also bind to the 6th site, but with higher affinity than dioxygen, which can lead to CO poisoning. The distal His keeps these ligands (including dioxygen) bound in a bent, non-optimal geometry. This minimizes the chances of CO poisoning.
- When oxygen binds to heme Fe2+, the geometry of the complex becomes octahedral. The Fe2+ has 6 electrons in d orbitals. (The electronic configuration of Fe is 3d64s2 while the Fe2+ ion is 3d6). From crystal field theory (review a general chemistry text), the ligand electrons pairs (treated as anions) interact with the d orbital Fe2+ electrons. They interact most strongly (in a repulsive fashion) with the dz2 and dx2-y2 Fe2+ electrons, which are oriented at the axial ends and equatorial corners, respectively, of the octahedral complex. This repulsion raises the energy of these two orbitals. The other three d orbitals feel less repulsion by the ligand electrons and are lower in energy. The difference in energy between the three lower energy levels of d electrons (in t orbitals) and the higher energy levels of electrons (in g orbitals) allows photons matching that energy difference to be absorbed as electrons are promoted to the g orbitals. Ligands that interact strongly with the dz2 and dx2-y2 electrons raise their energy even more, increasing the energy of the photon required to promote an electron from the t to g orbitals. Dioxygen is one of those ligands, leading to the absorbance of high energy photons, causing the solution to appear bright red (since blue light is absorbed). Because of this strong ligand, the significant energy gap between the t and g orbitals causes the electrons to reside mostly in the lower energy t orbitals where they remained paired, giving the complex a low spin state in which all 6 d electrons are paired. Hence oxyhemoglobin is diagmagnetic. The heme complex can also exist in a high spin state in which the electrons are easily excited to the g orbitals which are closer in energy to the t orbitals when the ligand is weakly interacting with the Fe2+ electrons. In these cases, the heme is paramagnetic since unpaired electrons are possible. (We will discuss paramagnetism latter in the course during our exploration of oxygen chemistry.
Figure: Heme-O2 Octahedral Complex
- When dioxyen binds, the oxidation state of the Fe2+ ion does not change, even through dioxygen is a great oxidizing agent. Hence the Fe2+ ion is a reversible carrier of dioxygen not of electrons. Free heme in solution is oxidized by dioxygen, forming a complex with water which occupies the 6th position, with the iron in the Fe3+ state. An intermediate in this process is the formation of a dimer of 2 hemes linked by 1 dioxygen. This can't occur readily when the heme is in Hb or Mb. Other heme proteins (like Cytochrome C) are designed to be carriers of electrons.
- A small amount of the Fe2+ ion gets oxidized to Fe3+ ion. Mb and Hb in this state are called metHb and metMb. A enzyme is required to reduced the iron back to the Fe2+ state.
![]() Jmol:
Updated deoxy-heme and carbon
monoxide-heme
Jmol14 (Java) |
JSMol (HTML5)
Jmol:
Updated deoxy-heme and carbon
monoxide-heme
Jmol14 (Java) |
JSMol (HTML5)
Myoglobin
- Mb is extremely compact, and consists of 75% alpha helical structure.
- 8 α−helices are present, labeled A-H.
- 4 alpha helices are terminated by Pro
- The interior amino acids are almost entirely nonpolar. The only polar amino acids found completely buried are the two His (proximal and distal) found at the active site of dioxygen binding.
![]() Jmol:
Updated Met-Myoglobin
Jmol14 (Java) |
JSMol (HTML5)
Jmol:
Updated Met-Myoglobin
Jmol14 (Java) |
JSMol (HTML5)
Difference between Hb and Mb
- Hb is a tetramer of two αand two β subunits held together by IMF's
(an example of quarternary protein structure), and 4 bound hemes, each
of which can bind a dioxygen. In a fetus, two other subunits make up
Hb (two zeta - ζand two epsilion - ε subunits -analogous to the two αand
two β subunits, respectively). This changes in fetuses to two α and
two γ subunits. Fetal Hb has higher affinity
for dioxygen than adult Hb. Mb is a single polypeptide chains which has
higher affinity for dioxygen than Hb.
The α and β chains are similar to Mb, which is unexpected since only 24 of 141 residues in the αand β chains of Hb are identical to amino acids in Mb. This suggests that different sequences can fold to similar structures. The globin fold of Mb and each chain of Hb is common to vertebrates and must be nature's design for dioxygen carriers. A comparison of the sequence of Hb from 60 species show much variability of amino acids, with only 9 identical amino founds. These must be important for structure/function. All internal changes are conservative (e.g. changing a nonpolar for a nonpolar amino acid). Not even Pro's are conserved, suggesting there are different ways to break helices. The two active site His are conserved, as is Gly B6 (required for a reverse turn). http://www.umass.edu/molvis/tutorials/hemoglobin/
![]()
![]() Jmol:
Hemoglobin
Jmol:
Hemoglobin
C2. Normal and Cooperative Binding of Dioxygen
Plots of Y (fractional saturation) vs L (pO2) are hyperbolic for Mb, but sigmoidal for Hb, suggesting cooperative binding of oxygen to Hb (binding of the first oxygen facilitates binding of second, etc).
Figure: Plots of Y (fractional saturation) vs L (pO2) are hyperbolic for Mb, but sigmoidal for Hb
In another difference, the affinity of Hb, but not of Mb, for dioxygen depends on pH. This is called the Bohr effect, after the father of Neils Bohr, who discovered it.
Figure: Bohr effect
Protons (decreasing pH), carbon dioxide, and bisphosphoglycerate, all allosteric ligands which bind distal to the oxygen binding sites on the heme, shift the binding curves of Hb for oxygen to the right, lowering the apparent affinity of Hb for oxygen. The same effects do not occur for Mb. These ligands regulate the binding of dioxygen to Hb.
From these clues we wish to understand the molecular and mathematical bases for the sigmoidal binding curves, and binding that can be so exquisitely regulated by allosteric ligands. The two obvious features that differ between Mb and Hb are the tetrameric nature of Hb and its multiple (4) binding sites for oxygen. Regulation of dioxygen binding is associated with conformational changes in Hb.
Based on crystallographic structures, two main conformational states appear to exists for Hb, the deoxy (or T - taut) state, and the oxy (or R -relaxed) state. The major shift in conformation occurs at the alpha-beta interface, where contacts with helices C and G and the FG corner are shifted on oxygenation.
Figure: Conformation Changes on Oxygen Binding to Deoxy-Hemoglobin (files aligned with DeepView, displayed with Pymol)
The deoxy or T form is stablized by 8 salt bridges which are broken in the transition to the oxy or R state.
Figure: Salt Bridges in Deoxy Hb
 Flash
Movie:
Salt Bridges in DeoxyHb
Flash
Movie:
Salt Bridges in DeoxyHb
6 of the salt bridges are between different subunits (as expected from the above analysis), with 4 of those involving the C- or N- terminus.
In addition, crucial H-bonds between Tyr 140 (alpha chain) or 145 (on the beta chain) and the carbonyl O of Val 93 (alpha chain) or 98 (beta chain) are broken. Crystal structures of oxy and deoxy Hb show that the major conformational shift occurs at the interface between the α and βsubunits. When the heme Fe binds oxygen it is pulled into the plan of the heme ring, a shift of about 0.2 nm. This small shift leads to larger conformational changes since the subunits are packed so tightly that compensatory changes in their arrangement must occur. The proximal His (coordinated to the Fe) is pulled toward the heme, which causes the F helix to shift, causing a change in the FG corner (the sequence separating the F and G helices) at the alpha-beta interface as well as the C and G helices at the interface, which all slide past each other to the oxy-or R conformation.
Decreasing pH shifts the oxygen binding curves to the right (to decreased oxygen affinity). Increased [proton] will cause protonation of basic side chains. In the pH range for the Bohr effect, the mostly likely side chain to get protonated is His (pKa around 6), which then becomes charged. The mostly likely candidate for protonation is His 146 (on the βchain - HC3) which can then form a salt bridge with Asp 94 of the β(FG1) chain. This salt bridge stabilizes the positive charge on the His and raises its pKa compared to the oxyHb state. Carbon dioxide binds covalently to the N terminus to form a negatively charge carbamate which forms a salt bridge with Arg 141 on the alpha chain. BPG, a strongly negatively charged ligand, binds in a pocket lined with Lys 82, His 2, and His 143 (all on the beta chain). It fits into a cavity present between the β subunits of the Hb tetramer in the T state. Notice all these allosteric effectors lead to the formation of more salt bridges which stabilize the T or deoxy state. The central cavity where BPG binds between the β subunits become much smaller on oxygen binding and the shift to the oxy or R state. Hence BPG is extruded from the cavity.
The binding of H+ and CO2 helps shift the equilibrium to deoxyHb which faciliates dumping of oxygen to the tissue. It is in respiring tissues that CO2 and H+ levels are high. CO2 is produced from the oxidation of glucose through glycolysis and the Krebs cycle. In addition, high levels of CO2 increase H+ levels through the following equilibrium:
H2O + CO2 <==> H2C03 <==> H+ + HCO3-
In addition, H+ increases due to production of weak acids such as pyruvic acid in glycolysis .
Hb, by binding CO2 and H+, in addition to O2, serves an additional function: it removes excess CO2 and H+ from the tissues where they build up. When deoxyHb with bound H+ and CO2 reaches the lungs, they leave as O2 builds and deoxyHb is converted to oxyHb.
C3. Mathematical Analysis of Cooperative Binding - Hill Plot
Previously we have shown that the binding of oxygen to Mb, which can be described by the equilibrium,
M + L <=> ML, can be described mathematically by
1) Y = L/[Kd +L].
This is the equation of a hyperbola. Remember, that this hyperbolic plot can be transformed in a variety of ways, as summarized in the graphs below for Mb.
Figure: 4 Ways to plot Mb and O2 plots
How does the sigmoidal binding curve for Hb arise. At least three models (Hill, MWC, and KNF) can be developed that give rise to sigmoidal binding curves. Remember, sigmoidal curves imply cooperative binding of oxygen to Hb: As oxygen binds, the next oxygen seems to bind with higher affinity (lower Kd)
Hill Model: In this model, we base our mathematical analysis on the fact
that the stoichiometry of binding is not one to one, but rather 4 to 1:
Perhaps a more useful equation to express the equilibrium would be M + 4L
<=> ML4. For this equilibrium, we can derive an equation analogous to the
equation 1 above. This equation is:
2) Y = L4/[Kd + L4].
For any given L and Kd, a corresponding Y can be calculated. Using this equation, the plot of Y vs L is not hyperbolic but sigmoidal (see next link below). Hence we're getting closer to modeling that actual data. However, there is one problem. This sigmoidal curve does not give a great fit to the actual oxygen binding curve for Hb. Maybe a better fit can be achieved by altering the exponents in equation 2. A more general equation for binding might be M + nL <=> MLn, which gives the following equation:
3) Y = Ln/[Kd + Ln].
If n is set to 2.8, the theoretical curve of Y
vs L gives the best but still not perfect fit to the experimental data.
It must seem arbitrary to change the exponent which seems to reflect the
stoichiometry of binding. What molecular interpretation could you give to
2.8Consider another meaning of the equilbrium described above:
M + 4L <=>
ML4. One interpretation of this is that all 4 oxygens bind at once to Hb.
Or, alternatively, the first one binds with some low affinity, which through
associated conformational changes changes the remaining 3 sites to very high
affinity sites which immediately bind oxygen if the oxygen concentration is
high enough. This model implies what is described as infinitely cooperative
binding of oxygen.
(Notice that this equation becomes: Y = L/[Kd + L], when n =1 (as in the case with myoglobin, and in any equilbrium expression of the form: M + L <==> ML. Remember plots of ML vs L or Y vs L gives hyperbolas, with Kd = L at Y = 0.5.)
Does Kd = L at Y = 0.5? The oxygen concentration at
which Y = 0.5 is defined as P50. We can substitute this value into equation
3 which gives an operational definition of Kd in terms of P50.
Y = 0.5 =
P50n/[Kd + P50n] - multiple both sides by 2
1 = 2P50n/[Kd + P50n]
Kd +
P50n = 2P50n
4) Kd = P50n
Note that for equation 3, Kd is
not the ligand concentration at half-saturation as we saw in the case with
hyperbolic binding curves.
![]() Wolfram
Mathematica CDF Player - Hill Model (free
plugin required)
Wolfram
Mathematica CDF Player - Hill Model (free
plugin required)
Now consider another model:
M + L <=> ML + L <=> ML2 + L <=> ML3 + L <=> ML4 where the binding of each oxygen to the unligated or increasing ligated Hb has the same Kd. That is, the affinity of each binding site for oxygen does not increase as more sites are bound to oxygen. In this model, n in equation 3 is 1, and the resulting graph is completely hyperbolic. The fact that the experimental data fits the equilbrium M + 2.8L <=> ML2.8 implies that the binding is cooperative but not infinitely cooperative. Graphs of Y vs L showing these three cases (n=1, 2.8, and 4) are shown below:
Figure: Plots of Y vs L for Hb with varying degrees of cooperativity: n = 1, 2. 8, and 4
The general equation 3), Y = Ln/[Kd + Ln]
can be rearranged as shown below:
1 - Y = [Kd + Ln]/[Kd + Ln] -
Ln/[Kd + Ln] =
5) 1 - Y = Kd/[Kd+ Ln]
where 1 -
Y is the fraction not bound. Solving for Y/[1-Y] by using equations 3
and 5 gives:
6) Y/[1-Y] = {Ln/[Kd + Ln]}/ Kd/[Kd + Ln] =
Ln/Kd.
Taking the log of both sides gives:
log
(Y/1-Y) = log ( Ln/Kd) =
7) log (Y/1-Y) = nlog L - log
Kd
A plot of log (Y/1-Y) vs log L is called a Hill plot, where n is
the Hill coefficient. This equation is of the form:
y
= mx + b which is a straight line with slope n and y intercept of - log Kd.
When n = 1, as it would be with Mb or Hb when oxygen binds to each site with
the same affinity irrespective of the number of other oxygens bound to other
sites, the Hill plot is linear with a slope of 1. Solving for the x
intercept (when the y axis variable is 0) in equations 7 gives:
8)
0 = nlog L -log Kd, or nlogL = log Kd, or log L = (logKd)/n.
The X intercept is when the dependent variable
"y" value is 0. This occurs when Y/(1-Y) = 1, which occurs at half
fractional saturation. (Remember log 1 = log 100 = 0)
Substituting equation 4 (Kd = P50n) into
(7) and (8) gives
(9) log (Y/1-Y) = nlog L - n log P50 - the Hill
Equation with P50 instead of Kd,
(10) 0 = nlog L -nlog P50, or nlogL =
nlog P50, or log L = logP50.
Even when n does not equal 1, the Hill plot is linear, since it has the form y=mx+b. If n = 2.8 or 4, the plot is linear, but has a slope of 2.8 and 4, respectively. This can be seen in the graph below which shows HIll plots with n = 1, 2.8, and 4.
Figure: Hill Plot for Mb (n =1)
However, the affinity of dixoygen for Hb changes, so that there must be more than one effective Kd. Hence, the actual Hill plot of Hb, log (Y/1-Y) vs log L, can not be linear over all ranges of dioxygen. A linear plot, such as for Mb, crosses the x axis at one point, with a value of (logKd)/n = logKd since n = 1. In contrast for Hb, since the Kd seems to change with L concentration, there can not be just 1 value of Kd, as given by the x intercept. The Hill plot of actual Hb binding data is curvilinear, and cross the x axis only once. Howver, the ends of the curve (at low and high dioxygen) approach straight lines with slopes of 1 (i.e. n=1). If extrapolated through the x axis, these lines would give the Kd for the binding of the first and last dioxygens, which bind noncooperatvely. LogL values near the region of the curve that crosses the x axis approximate a straight line with slope of 2.8. This implies there is maximal cooperativity in the middle of the binding curve. The graphs shows that the Kd for the first oxygen binding is much higher than the Kd for the last oxygen binding. Hence the Hill Plots supports our ideas than cooperativity is caused by conformational changes in Hb which occur on oxygen binding such that as progressively more oxygen is bound, the affinity for the remaining sites increases.
Figurre: Hill Plot for Hb: Black line showing hypothetical actual curve
C4. Mathematical Analysis of Cooperative Binding - MWC Symmetry Model
In the model MWC (Monod, Wyman, and Changeux) model, in the absence of ligand (oxygen), Hb exists in two distinct conformations, the T state (equivalent to the crystal structure of deoxyHb) and the R state (equivalent to the crystal structure of oxyHb without the oxygen). In the absence of dioxygen, the T state (T0) is greatly favored over the unliganded R state (R0) at equilibrium. An equilibrium constant (more equivalent to a dissociation constant) can be defined as L = T0/ R0. (Note: L is not the ligand concentration.) In addition, let us assume that Hb can not exist with some of the monomers in a tetramer in the T state while others in the same tetramer are in the R state. Hence this model is often called the symmetry model. Finally lets assume that each oxygen can bind to either the T or R state with the dissociation constants KT and KR respectively. These constants do not depend on the number of oxygens already bound to the tetramer. Hence KR = [R0][O2]/[R1] = [R1][O2]/[R2] = ... etc., where the subscript on R refers to the number of oxygens bound to that form of R.
Figure: LINKED EQUIIBRIA IN THE MWC MODEL
Now define two new parameters:
α
= [pO2]/KR which is really a normalized ligand concentration describing how
many times the KR the ligand concentration is.
c = KR/KT.
If oxygen binds preferentially to the R form of Hb, c would be a small fractional number. In the limiting case, when oxygen didn't bind to the T form, KT would be infinite, and c would equal 0.
Using these definitions and equations, the following equation showing Y, fractional saturation vs α can be derived, with n, the number of binding sites per molecule, = 4 for Hb.
Y = [α (1+α)n-1 + Lcα(1+cα)n-1]/[(1+α)n +L(1+cα)n]
Figure: Y Vs alpha with varying L and c - MWC MODEL
When L is set at 9000 and c = 0.014, the Y vs α curve fits the experimental oxygen binding data well. The graph below shows the best experimental dioxygen binding data that I could find (obtained from a graph, not from a table), and the best fit Y vs L using a Hill coefficient of n=2.8 (fitting equation 3 above), and the best fit of Y vs L using the MWC model, with L=9000, c=0.014, and Kr = 2.8 torr.
Figure: Hb binding curves: Experimental, vs Theoretical Hill and MWC Equations
![]() Wolfram
Mathematica CDF Player - MWC Model (free
plugin required)
Wolfram
Mathematica CDF Player - MWC Model (free
plugin required)
![]() Mathcad 8 -
MWC Model for Oxygen binding to Hb
Mathcad 8 -
MWC Model for Oxygen binding to Hb
Another way to think about the MWC Model
The MWC model assumes that oxygen binds to either the T or R form of Hb in a noncooperative fashion. That is KT and KR are constant, independent of the number of oxygens bound to that form. If that is so, what is the basis of the cooperative oxygen binding curves? The answer can be seen below. The red curve might reflect the binding of a ligand to the T form of a macromolecule, with Kd = 50 uM, for example. Notice that the binding curve is hyperbolic. Likewise, the blue curve might reflect the binding of a ligand to the R form of the macromolecule with Kd = 10 uM. If the T and R form are linked through the T <==> R equilibrium, this equilibrium will be shifted to the tighter binding R form with increasing ligand concentration, assuming that the ligand binds preferentially to the R form. This shifts the actual binding curve from that resembling the T form at low ligand (red) to that of the R form as ligand increases (blue), imparting sigmoidal characteristics to the actual binding curve (purple).
Figure: Cooperativity as transition between two hyperbolic binding curves with different Kd's

C5. Mathematical Analysis of Cooperative Binding - KNF Sequential Model
This KNF (Koshland, Nemethy, and Filmer) Sequential Model:model was developed to address concerns with the concerted model. One of the major problems with the concerted model is that it seemed unrealistic to expect all the subunits to change conformation together. Why shouldn't there be some difference in subunit conformation? The KNF model also fits the experimental data well.
Figure: EQUILIBRIA IN KNF MODEL
C6. Conformational Selection
In our study of hemoglobin structure in the MWC model, we developed the idea that there were two forms of hemoglobin in solution, the taut and relaxed form, which are pre-exisiting and interconvertible even in the absence of dioxygen. Oxygen was presumed to bind preferentially to the relaxed form. In the KNF model we saw that ligand binding can induce conformational changes in adjacent subunits, promoting cooperative binding of ligand. In general these two models distill down to combinations of two simpler models. The first might be called the conformational selection in which ligand binds tightly to a preexisting conformations in a "lock and key manner" without inducing subsequent macromolecular conformational change. Alternatively, the ligand might bind loosely and then alter the macromolecular conformation to produce tighter binding, an example of an induced fit model. For the binding of dioxygen to hemoglobin, thermodynamic cycles could be drawn showing either binding of ligand and subsequent conformational changes in protein structure or conformational changes in protein structure proceeding binding. Is there additional evidence to support the conformational selection model of binding of ligand to a protein that can, in the absence of ligand, exist in two conformations? The answer is yes.
Antibodies are immune system protein molecules than can bind "foreign" molecules and target them for biological neutralization. Many crystal structures have been determined of antibodies in the presence or absence of a "foreign" ligand molecule. In these cases, the conformation of the bound antibody is different from that of the free. Either an induced fit model for ligand binding or a lock and key model of binding of ligand to one of two different pre-existing conformations of the antibody could account for this observation. These different mechanisms could be differentiated experimentally by stop-flow kinetic technique since both display slow and fast phases that are affected differently by ligand concentration. Theoretically, in the induced fit model, only one ligand type could bind to the antibody which would undergo a conformational rearrangement to produce tighter binding. However, in the two preexisting conformational models, a different structural ligand might bind to each of the two main antibody conformations. James et al. have recently shown through stop flow kinetics techniques (to investigate binding) and x-ray crystallography (to investigate final structures) that one antibody molecule can, through existing in two different preexisting conformations, bind two different ligands (antigens). One antibody conformations binds small aromatic molecules with low affinity (including the small molecule 2,4-dinitrophenol, the immunizing molecule or hapten) and then rearranges to produce a high affinity binding complex in which the DNP is bound in a narrow cavity (reducing the effective off rate of the bound ligand. A second antibody conformation binds a protein ligand over a broad, flat binding site of the antibody molecule.
Lange (2008) et al, using a NMR technique, residual dipolar coupling, that allows sampling of structures in the microsecond time scale, have shown that the solution structure of ubiquitin (which we modeled in our first lab), in the absence of ligand, exists in an ensemble of conformational states. More importantly, these different conformational states are identical to those found in the 46 crystal structure of ligand complexed to various protein ligands, strongly supporting the concept of conformational selection. In all likelihood, a combination of both induced fit and conformational selection probably occurs within a 3D energy landscape in which an initial binding encounter by either a lock and key fit to the "optimal fit" conformer or to a higher energy conformer in which the bound state relaxes to a lower energy through the induction of shape changes in the binding protein.
Figure: Conformational Selection vs Induced Fit Binding (after Boehr and Wright, Science 320, 1429 (2008)
An interesting experimental model to distinguish conformational selection versus induced ligand binding was offered by Rea et al. They studied rabbit ileal bile acid binding protein (I-BABP). The wild type protein has a helix-turn-helix motif at its N terminus. They produced a mutant (Δa-I-BABP) that replaced this motif with a Gly-Gly-Ser-Gly linker, causing the protein to unfold. Next they conducted binding and folding studies on addition of taurochenodeoxycholate (TCDC) using stopped-flow fluorescence to measure the binding behavior. They wished to distinguish between two distinct mechanisms – folding before binding (or conformational selection) and binding before folding (or induced-fit model). The data support a two phase model. One phase did not depend on ligand and one did, suggesting binding followed by a conformational change).
Conformational Selection
![]()
Induced Fit
![]()
P* in the conformational selection models represents a high affinity, pre-existing conformation of the protein. In this model, high ligand shifts the equilibrium to the right.
One way to differentiate these models is to look at the dependency of the different kinetic phases on ligand. In the conformation selection model, the slow step is the formation of the high affinity form of the protein, P*. The first slow step has a nonlinear dependence in L while the fast second step has a linear dependence. The data did not fit this model well.
In the induced fit, the ligand binds to a low affinity and perhaps unfolded form of the protein, which subsequently collapses to the bound form in a slow step.
Both ligand dependent and independent phases are evident in the equation for the slow step for the induced fit mechanism. At high ligand concentration (when L >> k-1/k1) , the slow step in the induced fit would be independent of ligand (kslow = k-2 + k2). The authors state the data is consistent with a variant of induced fit called the "fly casting model". In this model the protein first encounters ligand and forms a hydrophobic collapse intermediate (PL) in a fast step characterized by a linear dependence on ligand concentration. Then the intermediate slowly interconverts into a wild type like complex through conformational re-arrangement. Wild-type protein binds the ligand 1000x as quickly, suggesting entropic barrier to binding of the ligand to the unfolded state and rearrangement of the protein thereafter.
Junker et al used atomic force microscopy (AFM) to observe the
effects of ligand binding on the folding/unfolding fluctuations of a single
molecule of calmodulin (CaM), a calcium-binding protein that binds
amphiphilic helicals peptides which leads to a large conformation change in
the protein. To do this, they sandwiched a single CaM molecule between
filamins that serve as attachment points for the AFM tip and a surface.
A slow pulling force was then applied to the molecule, and the length gain
was measured as the protein unfolded. The rapid fluctuations between
folded and unfolded states were quantified and used to derive a complete
energy landscape for the folding of CaM.
C7. Binding to Intrinsically Disorder Protein and MORFs
As described above, binding of a protein to a ligand (including another protein) could occur by a lock and key mechanism, possibly through a conformational selection process, or through an induced fit when an initial binding event is followed by a conformation rearrangement to form a more tightly bound complex. But how does binding to completely intrinsically disorder protein (which has been documented) occur? These cases are quite removed from those envisioned in simple induced fit mechanisms. To accommodate binding to IDPs, a new idea has emerged, that of Molecular Recognition Features (MoRFs).
MoRFs are typically contiguous but disordered sections of a protein that first encounter a binding partner (a protein for example). Using protein complexes in the Protein Data Bank, Mohan et al conducted a structural study of MoRFs by selecting short regions (less than 70 amino acids) from mostly disordered proteins that were bound to proteins of greater than 100 amino acids. They chose a sequence size of 70 amino acids and smaller since they would be most likely to display conformational flexibility before binding to a target. 2512 proteins fit their criteria. For comparison, they created a similar database of ordered monomeric proteins. The analysis showed that after they encounter a binding surface on another protein, the MoRF would adopt or "morp" into several types of new conformations, including alpha-helices (a-MoRFs), beta-strands (b-MoRFs), irregular strands (i-MoRFs) and combined secondary structure (complex-MoRFs), as shown in the figure below.
Figure: Types of Molecular Recognition Features in Intrinsically Disordered Proteins
(A) α-MoRF, Proteinase Inhibitor IA3, bound to Proteinase A (PDB entry 1DP5). (B) A β-MoRF, viral protein pVIc, bound to Human Adenovirus 2 Proteinase (PDB entry 1AVP). (C) An ι-MoRF, Amphiphysin, bound to α-adaptin C (PDB entry 1KY7). (D) A complex-MoRF, β-amyloid precursor protein (βAPP), bound to the PTB domain of the neuron specific protein X11 (PDB entry 1X11). Partner interfaces (gray surface) are also indicated. Vacic, V. et al. Journal of Proteome Research 6, 2351 (2007). Permission from Copyright Clearance Center's Rightslink /American Chemical Society
Vacic et al have further characterized the binding surfaces between MoRFs and their binding partners using structural data from PDB files. Interfaces were studied by determining the differences in accessible surface area between MoRFs and their binding partners, and the protein in unbound states. These were compared to ordered protein complexes, including homodimers and antibody-protein antigen interactions that were not characterized by disordered interactions. Their findings are summarized below.
-
MoRF interfaces have more hydrophobic groups and fewer polar groups compared to the surface of monomers. This is true even as the overall amino acid composition of intrinsically disordered protein shows them to be enriched in polar amino acids, which leads them to adopt a variety of unfixed solution conformations.
-
a-MoRFs have few prolines, which is expected as prolines are helix breakers.
-
Methionine is enriched in both MoRFs and in their binding partner interface. Methionine is unbranched, flexibile, and contains sulfur, which is large and polarizable, making it an ideal side chain to be involved in London forces in a hydrophobic environment.
-
Even though MoRFs have few residues, their binding interfaces were of similar or larger size than other protein binding interfaces, a result which also applies to IDPs as a whole. MoRFs interfaces also have a larger solvent-exposed surface area, similar to IDPs. This is consistent with the notion MoRFs are disordered before binding and that a defined structure is not possible with little buried surface area.
-
As MoRFs have significant nonpolar character within a IDP that is highly enriched in polar amino acids, MoRFs should be highly predictable by search algorithms.
C8. Binding and Intracellular Granules
We've studied different types of protein aggregation, including aggregation of the native state (to form dimers, trimers, multimers, filaments) or alternate conformations (such as in prion protein aggregation and formation of inclusion bodies of misfolded proteins). It turns out that messenger RNA (which ultimately get translated into proteins) aggregates not with itself but with RNA binding proteins (RBPs) to form intracellular granules. It turns out the these kinds of aggregates are commonly found in cell and have recently been recognized as non-membrane bound organelles. We've seen analogous particles, lipid droplets, which contain TAGs and cholesterol esters surrounded by a phospholipid monolayer with adsorbed protein, also promoted to the state of an organelle (in contrast to the recent demotion of the planet Pluto to a dwarf planet or plutoid).
How do these and other granules form. A quick review of the Cell Tutorial (scroll to bottom) shows granule formation can be caused by a classic "phase transition", not unlike gaseous water can self associate through hydrogen bonds to form liquid drops which can freeze with the formation of more hydrogen bonds to form solids. Soluble biomolecules in cells can reversibly aggregate through the summation of multiple weak IMFs to form storage granules. This balance might be perturbed if storage granules aggregate further in a potentially irreversible process with health consequences. We've seen examples of the latter when neurodegenerative diseases like Alzheimer's and Mad Cow Disease.
Many of the granules contain RNA and proteins and are called ribonucleoprotein bodies (RNPs) or RNA granules. Specific examples of these include cytoplasmic processing bodies, neuronal and germ granules, as well as nuclear Cajal bodies, nucleoli and nuclear dots/bodies). Some granules just contain proteins , including inclusion bodies with misfolded and aggregated proteins and those with active protein involved in biosynthesis, including the purinosome (for purine biosynthesis) and cellusomes (for cellulose degradation).
The cytoskeletal proteins actin and tubulin (heterodimer of alpha and beta chains) can exist in soluble (by analogy to water gaseous) states or in condensed filamentous state (actin filaments and microtubules respectively). GTP hydrolysis is required for tubulin formation. Actin binds ATP which is necessary for filament formation but ATP cleavage is required for depolymerization. Hence nucleotide binding/hydrolysis regulates the filament equilibrium which differentiates from simple phases changes such as in water.
Since only certain proteins form granules, they must have similar structural features that facilitate reversible binding interactions. There appear to be multiple sites with these protein that individually form weak binding interactions, but collectively through multivalent (multiple) binding interactions allow robust but not irreversible granule formation. Here are some characteristics of proteins found in granules:
- the protein NCK has 3 repeated domains (SH3) the bind to proline-rich motifs (PRMs) in the protein NWASP. These proteins are involved in actin polymerizaiton. In high concentration they precipitate from solution and coalesce to form larger droplets;
- repeating interaction domains are widely found especially among RNA binding proteins;
- some proteins contain Phe-Gly (FG) repeats separated by hydrophilic amino acids in portions of the protein that are intrinsically disordered.
- a biotinylated derivative of 5-aryl-isoxazole-3-carboxyamide (structure below) precipitates proteins which are enriched in those that bind RNA (RBPs). In general the precipitate proteins were intrinsically disordered characterized by low complexity sequences (LCS). One such example contained 27 repeats of the tripeptide sequence (G/S)Y(G/S). The proteins could also form hydrogels (made of hydrophilic polymers and crosslinks) and transition between soluble and gel phases with extensive hydrogen bond networks. The hydrogel gel phase gave x-ray diffraction patterns similar to beta structure-enriched amyloid proteins. Short ranged weak interactions between LCS might then drive reversible condensation to gel like granule states characterized by extensive hydrogen bonding (again similar to hydrogen bonding on ice formation). If this process goes awry, more continued and irreversible formation of a solid fibril (as seen in neurodegenerative diseases) might occur from the hydrogel state;
-
RNAs appear in granules as protein bind them through RNA binding domains of proteins which interact through low complexity sequences leading to phase separation and hydrogel-like formation of granules. Around 500 RNA binding proteins have been found in the human RNA interactome. They are enriched in LCSs and have more tryosines than average proteins in the whole proteome in which the Tyr are often found in an (G/S)Y(G/S) motif. Phosphorylation of tyrosines (Y) in LCS may decrease association and hydrogel stability.
Aggregation of mRNA might be one way to regulate its translation and hence indirectly regulate gene activity. There are advantages to regulating the translation of a protein from mRNA, especially if the "activity" of the mRNA could be dynamically regulated. This would be useful if new protein synthesis was immediately required. Hence one way to regulate mRNA activity (other than degradation) is through reversible aggregation.
C9. Binding and Linked Equilibria
Hemoglobin is an amazing molecule. Unlike myoglobin, in displays cooperative binding of dioxygen. In addition, not only does it bind dioxygen (at the heme Fe), it also binds protons and carbon dioxide at other, or allosteric sites. Binding of these ligands influences the binding of dioxygen, as seen from the right ward shift of the oxygen binding curves at lower pH's, such as would be encountered in respiring tissues. The linkage of the binding of dioxygen, and protons or carbon dioxide can be visualized easily with simple thermodynamics which you learned in general chemistry. Consider the equilibria shown below.
It should be obvious from these equations than K1 K4 = K2 K3 , where Ki are the dissociation constants for the various equilibrium. Remember than ΔG is a state function and independent of path. Hence ΔGo1 + ΔGo4 = ΔGo2 + ΔGo3 , where ΔGoi = -RTln(1/Kdi). From the oxygen binding graphs, it is also clear that K1 < K3. Therefore, it is clear that K2 < K4. This shows that protons binds to deoxyHb more tightly than to oxyHb. Hence, the presence of higher [H+] drives the dissociation of O2 from oxyHb. As described in the book, H+ bind to side chains which have an increased affinities for H+ in the deoxyHb state. The conformation change in Hb alters the effective environment of some side chains (specifically His β146, His α122, and the α amino group of the α chain), increasing their pKa values The protonated HisH+ then makes a salt bridge to Asp β 94 in the FG corner of the same β chain, forming a salt link which stabilizes the deoxyHb or taut state.
Figure: A review of thermodynamic cycles - linked equilibria - other examples
C10. Macromolecule Oligomer Formation and Symmetry
Many proteins are found in aggregated states and have quaternary structure. Hemoglobin consists of two alpha and two beta monomers (or protomers) which assemble to produce the biologically relevant heterotetrameric protein. As we discussed in Chapter 5A - Reversible Binding I, a given monomer can self aggregate to form homooligomers (dimers, trimers, tetramers, or Mn). The polymers display symmetry with respect to the geometric arrangement of the subunits. Symmetry, as we have just seen, is an important component of the MWC model. Most oligomeric proteins contain protomers that are symmetrically arranged. What mechanism determines whether a monomeric protein forms a homooligomer? Why do they stop at a certain n value? Can proteins be engineered to do so? If mutation can induce oligomer formation, then fewer mutations would be required to produce a symmetric oligomer from subunits since fewer mutations would be required as a single mutation in a single monomer would be represented n times in a single oligomer of n monomers. This fact probably underlies the reason that oligomers display exquisite symmetry. Hence a basic knowledge of symmetry of protein oligomers is necessary.
In the study of small molecules, chemists describe symmetry through the use of mathematical symmetry operations and elements, which find great use in analysis of structure and in molecular spectroscopy. These concepts are usually first encountered in physical and inorganic chemistry classes. A symmetry operation is a movement of an object like a molecule that leads to an identical, superimposable molecule.. Each operation has a symmetry element (point, line, or plane) about which the motion occurs. Some examples are shown below:
Table: Symmetry Elements and Operations
| Element (with Jmol link) | Operation |
| inversion center (i) | projection through center (point) of symmetry of point x,y,z to point -x,-y,-z |
| proper rotation axis (Cn) | rotation around a Cn axis by 360o/n where C denotes Cyclic |
| horizontal (σh) and vertical (σv) symmetry plane | reflection across a horizontal or vertical plane |
| improper rotation axis (Sn) | rotation around a Sn axis by 360o/n followed by reflection in plane perpendicular to the axis. |
Luckily for students trying to apply these rules to protein oligomers, biomolecules made up of chiral monomers (such as the L-amino acids of proteins) can not be converted to identical structures using inversion or reflection since the chirality of monomer would change - for proteins this would entail and L to D amino acid change. That excludes all but proper rotation axes (Cn) from the list above.
A point group is a collection of symmetry operations that define the symmetry about a point. The 4 types of symmetries around a point are those described above: rotational symmetry, inversion symmetry, mirror symmetry, and improper rotation. The types of point groups around a point include:
-
cyclic (Cn) - contain one single Cn rotation axis. A biological example is the tobacco mosaic virus double disk (34 monomers, C17). In this point group note that the n in Cn is equal to the number of monomers and the angle of rotation is 360o/n.
Figure: C2 Symmetry
-
dihedral (Dn) - These have mutually perpendicular rotation axes. Specifically they contain at least 1 C2 axis perpendicular to a Cn axis (Canter and Schimmel. Biophysical Chemistry - Part 1). The minimal number of subunits is n. Most protein oligomers fall into this category. The packing (or asymmetric) unit does not have to be a single monomer but could be a heteodimer.
-
A D2 point group has 1 C2 axis and 2 perpendicular C2 axes, and 4 monomers (like Hb). These proteins can dissociate into two dimers (such as two α/β dimers for Hb). Note that a different arrangment of 4 monomers could produce a oligomer with C4 symmetry instead of D2.
-
A D4 point group has 1 C4 axis and 4 C2 axes, along with 2n=8 subunits. An example of a D4 point group is ribulose bisphosphate carboxylase/oxygenase (RuBisCO) which has 8 subunits (where a subunit, or more technically the assymetric subunit, is a dimer of a small and large molecular weight protein). This point group could arise from quaternary structure of two C4 tetramers or four C2 dimers.
-
Figure: D2 Symmetry
-
cubic - contain four C3 axes connecting opposite corners of a cube (so the lines are effectively diagonals) arranged as the four body diagonals (lines connecting opposite corners) of a cube. The tetrahedron (4 sides), cube (6), octahedron (8), and icosohedron (20), perfect Platonic solids (in which all faces, edges and angles are congruent) all have related 3 C3 axes (diagonals connecting opposite corners for cubes, diagonals from a vertex to the opposite face for tetrahedrons, line connecting two opposite faces for octahedron, etc ) so they all can be considered to be part of the cubic point group.
Cubes have a total of 13 symmetry axes comprising 3 types (three C4 axes passing through the centers of opposite faces, four C3 axes passing through opposite vertices, and six C2 axes passing through the the centers of opposite edges). On octahedron can be aligned with a cube and be shown to have the same symmetry axes.
-
Flash movie: Cube (red) and Octrahedron (blue) with 13 symmetry axes.
Tetrahedrons have a total of 7 symmetry axes comprising two types (four C3 axes of the cube and three C2 axes which are the same as the C4 axes of the cube. First note the relationship between a cube and an inscribed tetrahedron.
-
Flash movie: Tetrahedron with 7 symmetry axes.
A dodecahedron with 12 regular pentagon faces (green) and an icosohedron with 20 equilateral triangle sides (red) can be aligned with each other (as can cubes and octahedrons) and have 31 symmetry axes, as shown below. Note also the relations between a cube inside a dodecahedron and a octahedron inside of a dodecahedron that makes sharing of symmetry axes between these pairs more obvious.
-
Flash movie: dodecahedron and icosohedron with 31 symmetry axes.
vrml files for movies from http://www.georgehart.com/virtual-polyhedra/symmetry_axes.html
Examples of protein complexes with these point groups are:
-
aspartate-ß-decarboxylase, tetrahedral, 12 asymmetric units
-
dihydrolipoyl transsuccinylase, octahedral, 24 asymmetric subunits
-
many spherical viruses, icosahedral, 60 asymmetric units
![]() Jmol: Updated
Symmetry in Protein Oligomers (beta version with lots of work left to do)
Jmol14 (Java) |
JSMol (HTML5)
Jmol: Updated
Symmetry in Protein Oligomers (beta version with lots of work left to do)
Jmol14 (Java) |
JSMol (HTML5)
Proteins, especially those involved in cytoskeletal filaments, can form fibers which contain helical symmetry which differs from those described above since the monomers at the ends of helical fibers, although they have the same tertiary structures as those in the middle of the helical fibers, do not contact the same number of monomers as monomers internal in the oligomer and hence have different microenvironments.
A recent article by Grueninger et al. addresses the question of whether the process of oligomerization can be programmed into the genome. Can simple amino acid substitutions lead to oligomerization? Remember that oligomerization can be beneficial (formation of cytoskeleton filaments) or detrimental (formation of fibers in sickle cell anemia and mad cow disease). Oligomers with long half-lives (for example cytoskeletal filament such as actin and tubulin) and short half-lives (for example proteins causes transient activities are regulated by oligomer formation) are both necessary.
It has long been noted that if a protein chain forms oligomers, then a single amino acid change in the chain would be found n times in an oligomer of n chains. Mutations could either promote chain contact and oligomer formation or dissociation into monomeric or other asymmetric subunit composition if the mutation were in a region involved in subunit association (a contact region). Experimental work in this field of study is hampered by the fact that mutants made by site-specific mutagenesis to prefer the monomeric state often fail to fold (due to hydrophobic exposure and aggregation. Studies have shown that most contact areas between monomers or other asymmetric units are hydrophobic in nature and the contact regions must be complementary in shape. Obviously mutations that replace hydrophobic side chains involved in subunit contact with polar, polar charged, or bulkier hydrophobic side chains would inhibit oligomer formation.
Grueninger et al were able to successfully engineer dimer formation and oligomer formation as well. First consider the simplest case of a mutation in a monomer that can produce a dimer with C2 symmetry. This is illustrated below which also shows how a mutation that produces a weak interaction in a monomer could also produce a long helical aggregate (which can't be crystallized) without symmetry (as described above). A mutation at 2 could promote either oligomer helix formation or dimerization.
Figure: Mutations causing Dimer with C2 symmetry or Infinite Helix

(adapted from Grueninger et al. Science, 319, 206-209 (2008)
It should be noted that mutation could lead to dimer or oligomer formation by producing a more global conformational change in the monomer (not indicated in the example above) which leads to aggregate formation, as we have seen previously in the formation of dimers and aggregates of proteins associated with neurodegenerative diseases (like mad cow disease).
Grueninger produces mutants of two different proteins that showed dimer formation as analyzed by gel filtration chromatography (but did not crystallize so no 3D structures were determined). In addition the group modified urocanase, a C2 dimer, at 3 side chains to form a tetramer with D2 symmetry. Also, they modified L-rhamnulose-1-phosphae, a C4 tetramer, at a single position to form an octamer with D4 symmetry. The latter two were analyzed through x-ray crystallography. Their work suggests ways that complex symmetric protein structures arose in nature from simple mutation and evolutionary selection.
C11. Conformational and Binding - Examples
Conformational changes in macromolecule structure upon ligand binding are common features of such interactions. Interesting examples of conformational effects on binding are described below. Protein activities can often be modeled using the assumption of two major, different conformational forms. The first example, however, describes time-resolved structural changes in a protein on ligand release.
Unbinding of a ligand from a protein
As a complete understanding of an organic reaction requires a knowledge of the structures of reactants, transition states, intermediates and products along the reaction coordinates, so is the knowledge of different structural states along the dissociative pathway necessary for a complete understanding of the dissociative (and by inference the associative) mechanisms of ligand binding. Such a time-resolved pathway can be studied through molecular dynamics simulations. Schotte et al. have recently studied the dissociation of CO from carboxy-L29F-myoglobin to deoxy-L29F-Mb using time-resolved x-ray crystallography. (L29F is a mutant form of the wild type in which Leu 29 has been changed to Phe.) They chose this mutant since evidence of a short-lived (140 ps lifetime) intermediate in the flash-photolyzed dissociation of CO from the mutant was found using time-resolved mid-infrared spectroscopy of CO-L29F-myoglobin. In this technique, the CO-L29F-Mb is pulsed with an orange laser to photolyse the CO-Mb complex. After a brief delay, an IR pulse tuned to the CO stretch was added. The spectra of the mutant Mb showed two bands which converted to one broad band with time. The two bands represent two different orientations of the CO at the heme Fe, while the broad band arises when the CO dissociates from the primary site to other sites. The intermediate represented a structure in which CO was trapped in a binding site adjacent to the heme Fe which presumably is also a binding site for the initial association of the ligand. This site found in molecular dynamics simulations consisted of the heme and Val68, Ile 107, and Leu29 side chains, all of which are conserved in mammalian myoglobins. Time-resolved x-ray structures were obtained after orange laser-induced photolysis, followed by time-delayed x-ray pulses. These structures showed much larger changes in structure than the differences in structure between the deoxy-and oxy-Mb x-ray structures would suggest. The side changes exhibits coordinated motions that "sweeps" the CO away, accounting for the fast dissociation of the bound CO.
An Engineered Allosteric Enzyme
Do you ever wonder if your respiratory infection is viral, bacterial, or fungal in origin? Most patients would probably like an antibiotic but with the rise of resistant bacteria, unwarranted use of antibiotics is not wise. Wouldn't it be great if a quick test could be done to distinguish among these possibilities? A new sensitive and rapid method to analyze for specific DNA sequences (which could provide the needed distinction) has been developed by Saghatelian et. al. They have made an enzyme with a covalently attached single-stranded DNA sequence - an inhibitor-DNA-enzyme (IDE) complex.
Figure: inhibitor-DNA-enzyme (IDE) complex
To the other end of the DNA is covalently attached an inhibitor of the enzyme. The inhibitor, tethered to the ssDNA, can bind to and inhibit the enzyme. Now if a complementary strand of DNA (derived from the bacterial, virus, etc) is added, it can bind to the ssDNA tether through complementary H-bond interactions to form a dsDNA in which the inhibitor is removed from the active site of the enzyme. The complementary DNA is, in effect, an allosteric activator, or more accurately a deinhibitor, of the enzyme. If a substrate is now added which can bind to the enzyme active site and form a fluorescent product, a very sensitive and quick assay is available. Saghatelian used a protease from B. cereus (CNP) and the substrate DABCYL-peptide-EDANS. The DABCYL group on this substrate is a quencher or the EDANS fluorophore. When cleaved by the enzyme, EDANS fluoresces intensely. The assay detected 10 fmol of DNA in less than three minutes.
Controlling the activity of a protein may be achieved through the binding of an allosteric effector at specific binding sites on a given protein. Another technique for allosteric control is to bind two monomeric proteins to form a two-domain complex in which one monomer allosterically activate the other. Lee et al recently engineering such a binding interaction using a light-sensing protein, phototropin LOV2 (LOV2), as the allosteric effector domain and E. coli dihydrofolate reductase (EcDHFR) as the catalytical domain. The reaction is monitored by the reduction of dihydofolate to tetrahydrafolate. Investigators made chimera in with the LOV2 domain was connected through its N and C terminal helices to bound to EcDHFR at two sites on its surface: Site A, which noticeably affected the activity of the EcDHFR active site, and Site B, which had little influence on the rate of hydride transfer, khyd (EcDHFR activity). The khyd of the chimeric LOV2-EcDHFR protein bound at Site B was not affected by the conformational shifts of the allosteric effector, which were induced by light. On the other hand, the khyd of the Site A protein was significantly enhanced when light modified the LOV2 structure. This successfully demonstrated substrate activity modification by adjusting the effector.
Circadian Rhythms and the Biological Clock
Many human behaviors are cyclic with a repeat period of 24 hours (such as sleep/wake cycles). These circadian rhythms, which can be phase-shifted by alternations in environmental cues (such as light intensity, sleep deprivation) must have some biochemical basis. Understanding the mechanisms underlying circadian rhythms and its regulations would prove helpful in developing new ways to help people minimize the influence of jet lag or shift work. In humans, light intensity information is transmitted from the retina to the suprachiasmatic nucleus in the hypothalmus (in the brain), which then signals the pineal gland (behind the hypothalmus) to secrete the hormone melatonin. Its levels rise at night and fall in the day, but its biochemical mechanism of action is still being determined. Other hormones are also involved. What are the biochemical targets of these hormones? What is the basis of circadian changes in individual cells?
One such protein is the membrane enzyme (Hydroquinone) NADH Oxidase (NOX). NADH is a small cellular reducing agent that we will discuss in the future. This enzyme is found in the external plasma membrane of all human cells, including tumor cells. NOX proteins are very usual in that they possess two activities: a NADH oxidase activity (measured by the disappearance of of NADH) and a protein disulfide isomerase (thiol interchange) activity (measured by the renaturation of RNase A using cCMP as a substrate or the cleavage of dithiodipyridine). These activities alternate in a temporal sense with a 24 minute period! The normal cellular form of the protein is constitutively expressed and responsive to hormones. A form found specifically on tumor cells, tNOX, is inhibited by certain chemotherapeutic drugs and by capsaicin (the active ingredient in hot peppers), and is not responsive to hormones (suggesting unregulated activity). tNOX has a 22 minute period. In cancer patients, a truncated form of tNOX (ttNOX), formed by limited proteolysis from tNOX, is found in the serum. NOX proteins are also resistant to proteases and can self aggregate to form "amyloid" type fibrils similar to those found in prion diseases. They can also interact with other proteins and render them protease resistant. The temporal periods of both proteins are independent of temperature and can be "entrained" through the appropriate stimuli. What structural features of the protein can account for unique properties. Early evidence (using FTIR and CD) suggests that changes in secondary structure (similar to prion proteins) occurs involving changes from alpha helices to beta sheets. Perhaps the protein can exist in two distinct, yet similar conformations, each with a different activity.
The tNOX gene has been cloned and expressed. It encodes a protein of 610 amino acids, and its activities, when expressed in bacteria, cycle in 22 minutes. Site-specific mutations produce periods of 36 minutes (for Cys575Ala) and 42 minutes (for Cys558Ala) mutants. These proteins show the same activities and periods when produced in transformed eukaryotic COS-1 cells. This cell surface proteins affects the circadian rhythms of the whole cell. A normal protein in the cell, glyceraldehyde -3-phosphate dehydrogenase, (GAPDH) exhibits a 24 hour activity circadian rhythm in normal COS cells (which have a constitutively expressed NOX gene product). When transformed with the mutants, the demonstrate not only a 24 hour GAPDH activity, but in addition, a 22, 36, or 42 hour activity when transformed with the gene for tNOX, the tNOX Cys575Ala mutant, and the tNOX Cys558Ala mutant respectively.
HIV Binding to T helper immune cells
It has been notoriously difficult to develop a vaccine against the HIV virus. One type of vaccine results in the formation of protective proteins called antibodies, which bind to an immunogen in the vaccine and ultimately to a "foreign" molecule such as a protein on the surface of an actual virus or bacterial cell. The HIV has a surface protein, gp120, which binds to a receptor protein, CD4, on the surface of certain immune cells like the T helper cell. If this interaction could be prevented, then HIV could not enter cells. Many attempts have been made to develop neutralizing antibodies to gp120 by using gp120 and variants as an immunogen. These have all failed. Further work has shown that when gp120 binds to the receptor protein CD4, the gp120 undergoes a conformational change which allows a newly exposed loop on gp120 to bind to yet another coreceptor, CCR5, on the immune cell, facilitating virus uptake into the cell. The exposed loop conformation of the gp120 seems to resemble the structure of a normal protein ligand (the chemokine RANTES) for the CCR5 receptor. Such examples of molecular mimicry are becoming more common. Recently, the crystal structure of an unliganded simian virus gp120 protein has been determined (Chen et al.). Comparison of this to the bound form (to CD4) shows clear conformational changes. Small inhibitors could be designed to the unbound form, locking it in that conformation which would prevent viral entry into cells.
First consider the cell bound state. There appears to be a very large structural change in gp120 on binding CD4. When this happens, another part of the gp120 protein is exposed, which then binds to another protein "coreceptor" on the cell. This dual binding to the CD4 and the coreceptor "hides" the gp120 from potential neutralizing antibodies, perhaps by steric exclusion.
What about the fee state? Why can't it interact with neutralizing antibodies? Chen et al have recently determined the structure of the free gp120 protein. On binding to CD4, half of the gp120 refolds, bringing distal residues together to allow binding to co-receptor. Before binding, three copies of gp120 are found on surface viral spikes. Critical residues on gp120 for possible immune recognition appear to be inhibited from antibody binding since they point towards each other which sequesters them. In addition, carbohydrates covalently attached to the gp120 also shield amino acid side chains from immune recognition. Such large changes in protein structure are also seen with part of the influenza virus surface proteins that allow fusion of viral and target cell membranes, and subsequent viral uptake into the cell. They may be a hallmark of viral-target cell interactions.
To a first approximation, the protein may be considered to have two formations, the free and bound forms. Any small molecule which would preferentially bind to the free form could shift the equibrium to that from, and hence prevent viral infectivity. Antibodies that have those properties (i.e. neutralizing) appear to be difficult for the immune system to make. However, small ligand which bind in cavities present in the free form would have such properties. New viral-entry inhibitors have been found that appear to bind in such cavities. Lin et al. PNAS 100, 11013 (2003)
![]() Jmol:
Updated Unliganded gp120 core (HIV
viral protein) )
Jmol14 (Java) |
JSMol (HTML5) NOTUPDATED
Jmol:
Updated Unliganded gp120 core (HIV
viral protein) )
Jmol14 (Java) |
JSMol (HTML5) NOTUPDATED
Parainfluenza Virus Protein
The parainfluenza 5F protein catalyzes the viral and cellular membranes allowing for the entry of the viral genome into the cell. The F protein undergoes refolding during this process, which leads to differing conformations when it is in the pre- and post- transitional states. The parainfluenza virus is similar to other paramyxovirides, (enveloped viruses) which include: mumps, measles, sendai, Newcastle, and the human respiratory sincytial virus. The parainfluenza 5F protein consists of a globular head attached to a trimeric coiled-coil stalk formed by the C-terminal of the HRB region. This exact form of the virus shown in this tutorial is that of the pre-conformational state in which the stalk sits above the viral membrane.
![]() Jmol: Updated
Parainfluenza Virus 5F Protein
Jmol14 (Java) |
JSMol (HTML5)
Jmol: Updated
Parainfluenza Virus 5F Protein
Jmol14 (Java) |
JSMol (HTML5)
Additional Links
-
 PDB
- Binding Database: A comprehensive collection of the
experimentally measured binding affinity data for all types of
biomolecular complexes deposited in the Protein Data Bank (PDB).
PDB
- Binding Database: A comprehensive collection of the
experimentally measured binding affinity data for all types of
biomolecular complexes deposited in the Protein Data Bank (PDB).
C12. Free Energy and Cooperativity
(a great example of the use of thermodynamic cycles in modern biochemical analysis)
To change the conformation of deoxyHb to oxyHb requires energy (about 6 kcal/mol, or the equivalent of about 2 H-bonds. Remember from our discussion of protein stability, proteins are not inherently all that stable. They denature at modest temperatures, and are stabilized over the native state only about 10 kcal/mol for a typical protein of 100 amino acids. Energy changes in proteins can arise from ligand binding, or tertiary/quaternary structural changes in the protein. Consider the following important points about O2 binding.
- the beta chain of Hb binds O2 noncooperatively, with a Kd similar to Mb.
- the hemoglobin tetramer (T) readily dissociates into alpha-beta dimers (D), which also bind O2 with high affinity, and noncooperatively.
Hence, when 2D ----> T, there is an energy
penalty in the form of a greatly reduced O2 affinity, but what is acquired
is the property of cooperativity for O2 binding, which facilitates maximal
unloading of O2 under physiological conditions. This cooperativity can be
measure as ΔGcoop =
ΔGc, where
ΔGc
= ΔGO2 bind to tetramer
- ΔGO2 bind to same site on dimer, or
ΔGc
= ΔGT - ΔGD.
The ΔGT and the ΔGD
can be determined from the binding isotherms (Y vs [O2] at various dilutions
of the tetramer). Then ΔGc
can be calculated. The results are shown below.
Table 1: Free Energy of Oxygen Binding to Hb T and D.
The tables above show the ΔGc for oxygen binding to various states of Hb. Notice that ΔGc is positive for the first 3 bindings, and negative for the last.
The cooperativity models for oxygen-Hb binding (the MWC -concerted model and the KNF- sequential model) are based on the two end states (fully ligated and fully unligated) and the stepwise states (1, 2, or 3 O2 bound). They do not describe binding to specific sites on the Hb tetramer. That is, they do not reflect the different possible microstates. For example, there are 4 different microstates possible in which 2 O2 are bound to the tetramer (see Table 1). There are 8 different possible partially liganded microstates (Table 1). It has been difficult to study each of these microstates directly since it is impossible to isolate them in pure form, or to resolve their different properties in a mixture. Three reasons account for this:
- each state is labile and O2 exchanges among the states
- the tetramer (T) dissociates to 2D which reassociates to give hybrids.
- the lower relative abundance of intermediates in a cooperative system.
This problem was solved by suing CO, NO, and CN as ligands, since they bind more tightly. Also the Fe can be replaced with Co(II) or Mn (III). We have studied linked equilibrium before:
- 2 N-methylacetamide monomers (aq) ---> N-methylacetamide H-bonded dimer (nonpolar)
- deoxyHb <---> oxyHb in the presence of H+ and CO2 (see above)
We have seen, especially in the former case how thermodynamic cycles or linked equilibria can be used to calculate ΔG and K's for reactions which would be difficult to carry out. Let us now apply these concepts to Hb binding to ligands. Specifically, we wish to calculate ΔGc from the Δ Gs for binding of a ligand to a specific site on a dimer and on the tetramer, as shown below.
It should be obvious that:
ΔGo1 + ΔGo2 = ΔGo3 + ΔGo4 , or ΔGo3 - ΔGo1 = ΔGo2 - ΔGo4 = ΔGoc . It is not difficult to determine ΔGo3 - ΔGo1 which can be determined using gel filtration chromatography since dimers can readily be separated from tetramers. Methods can be developed to prepare individual microstates and then the assembly free energy can be determined. From this, using thermodynamic cycles, the ΔGoc can be calculated. The results for a Cyanomet Hb microstates are shown in Table 2. The 10 microstates are distributed into 3 distinct cooperative free energies. This suggests that there may be a problem with the MWC model which proposes 2 quaternary states, the T and the R. Is there a third quaternary state, or is there a change in the tertiary structure of the R or T states which generate 3 kcal/mol of cooperative free energy? If the unligated "deoxy"state is the T state, and if the microstates 11,12, and 21 are also assigned to the T state, then the T -->R transition occurs when binding creates a tetramer with 1 or more ligated subunits on each side of the dimer/dimer interface.
The overall ΔGc is generated by two different conformational changes. On binding the first ligand, global conformational changes occur in the ligated dimeric state. The D/D interface acts as a structural constraint against which tertiary structure changes. When oxygen binds to the dissociated dimer, it does not produce a tertiary structural change since there is no interface to oppose the ligand. This strained tertiary conformation raises the energy by +3 kcal/mol. The second conformational change produces a global quaternary change, as the salt bridges break and the T state changes to the R state.
The formation and release of the tertiary constraint is the driving force of cooperative ligand binding. The strength of the T interface is overcome ony when unfavorable ligand induced conformational changes occur in both dimers. The T interface can withstand 1 dimer with the changed tertiary conformation, not 2. The movement of Fe into the plane of the heme ring triggers the tertiary change. The trigger for the quaternary change is the tertiary changes in the dimers.
Now that you understand dioxygen binding, explain the following picture.
 Of Mice and Oxygen
 Another view
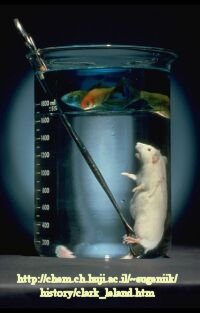 Liquid
breathing
Liquid
breathingC13. Links and References
- Vacic, V. et al. Characterization of Molecular Recognition Features, MoRFs, and Their Binding Partners. Journal of Proteome Research 6, 2351 (2007) DOI: 10.1021/pr0701411
- Mohan, A. et al Analysis of molecular recognition features (MoRFs). J Mol Biol. 362, 1043 (2006)
- Junker, J et al. Science 323, pp. 633-637 (2009)
- Lee, J. et al. Surface Sites for Engineering of Allosteric Control in Proteins. Science 322, 438 (2008)
- Rea, A. et al. Mechanism of Ligand-Induced Folding of a Natively Unfolded Helixless Variant of Rabbit I-BABP. Biochemistry, 48, 7556 (2009)
- Boehr, D. and Wright, P. How Do Proteins Interact. Science 320, 1429 (2008)
- Lange, O. . Science 320: 1471 (2008)
- Greuninger, D. et al. Designed Protein-Protein Association. Science. 319, pg 206 (2008)
- Chen, B. et al. Structure of an unliganded simian immunodeficiency virus gp120 core. Nature. 433, pg 834 (2005)
- Koshland, D. and Hamadani, K. Proteomic and Models for Enzyme Cooperativity. J. Biol. Chem. 277, pg 46841 (2002)
- Schotte, F. et al. Watching a protein as it functions with 50 ps time-resolved X-ray crystallography. Science, 300, pg 1944 (2003)
- James, L. et al. Antibody Multispecificity Mediated by Conformational Diversity. Science. 299, pg 1362 (2003)
- Chueh, P. et al. Molecular Cloning and Characterizatio of a Tumor-Associated, Growth-Related, and Time-Keeping Hydroquinone (NADH) Oxidase (tNOX) of the HeLa Cell Surface. Biochemistry. 41, pg 3732 (2002)
- Morre et al. Biochemical Basis for the Biological Clock. Biochemistry, 41, pg 11941 (2002)
- Lipton et al. Nitric Oxide and Respiration. (about role of Hb in carrying NO). Nature. 413, pg 118, 171 (2001)
- Volkman et al. Two State Allosteric Behavior in a single-domain signaling protein. Science. 291, pg 2329, 2429 (2001)
 Navigation
Return to Biochemistry Online Table of Contents
Archived version of full Chapter 5C: Model Binding Systems

Biochemistry Online by Henry Jakubowski is licensed under a Creative Commons Attribution-NonCommercial 4.0 International License.