Biochemistry Online: An Approach Based on Chemical Logic

CHAPTER 2 - PROTEIN STRUCTURE
B: PROBING COMPOSITION, SEQUENCE, AND CONFORMATION
BIOCHEMISTRY - DR. JAKUBOWSKI
2/28/16
|
Learning Goals/Objectives for Chapter 2B: After class and this reading, students will be able to describe in general terms the procedures and chemical steps in the determinations of the following for proteins:
|
B1. Amino Acid Analysis and Chemical Sequencing
As described in the Introduction to Proteins, we can understand proteins structure at varying level of complexity.
Figure: Protein Analysis from low to high resolution.
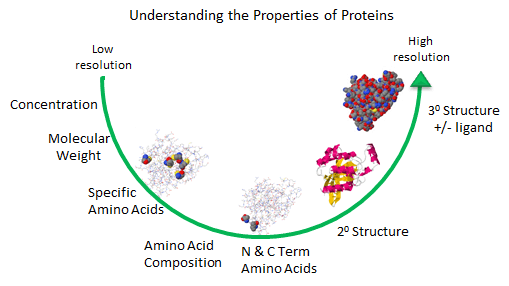
In the last chapter section, we learned about the charge and chemical reactivity properties of isolated amino acids and amino acids in proteins. The analysis of a whole protein is complicated since each different amino acid might be represented many times in the sequence. Each protein has an N-terminal and C-terminal amino acid and secondary structure. Some proteins exists biologically as multisubunit proteins, which adds to the complexity of the analyses since now the proteins would have multiple N- and C-terminal ends. In addition, isolated proteins might have chemically modifications (post-translational) which add to the functionalities of the proteins but also add to the complexities of the analyses. To illustrate some of these issues, view the structure of the RhoA program below.
![]() Updated
RhoA - a cytoplasmic protein - The
complexity of protein analysis
Jmol14 (Java) |
JSMol (HTML5)
Updated
RhoA - a cytoplasmic protein - The
complexity of protein analysis
Jmol14 (Java) |
JSMol (HTML5)
Amino Acid Composition
At a low level of resolution, we can determine the amino acid composition of the protein by hydrolyzing the protein in 6 N HCl, 100oC, under vacuum for various time intervals. After removing the HCl, the hydrolysate is applied to an ion-exchange or hydrophobic interaction column, and the amino acids eluted and quantitated with respect to known standards. A non naturally- occurring amino acid like norleucine is added in known amounts as an internal standard to monitor quantitative recovery during the reactions. The separated amino acids are often derivitized with ninhydrin or phenylisothiocyantate to facilitate their detection. The reaction is usually allowed to procedure for 24, 36, and 48 hours, since amino acids with OH (like ser) are destroyed. A time course allows the concentration of Ser at time t=0 to be extrapolated. Trp is also destroyed during the process. In addition, the amide links in the side chains of Gln and Asn are hydrolyzed to form Glu and Asp, respectively.
- AA Analysis: Iowa State University Protein Facility
N- and C-Terminal Amino Acid Analysis
The amino acid composition does not give the sequence of the protein. The N-terminus of the protein can be determined by reacting the protein with fluorodinitrobenzene (FDNB) or dansyl chloride, which reacts with any free amine in the protein, including the epsilon amino group of lysine. The amino group of the protein is linked to the aromatic ring of the DNB through an amine and to the dansyl group by a sulfonamide, and are hence stable to hydrolysis. The protein is hydrolyzed in 6 N HCl, and the amino acids separated by TLC or HPLC. Two spots should result if the protein was a single chain, with some Lys residues. The labeled amino acid other than Lys is the N-terminal amino acid. The C-terminal amino acid can be determined by addition of carboxypeptidases, enzymes which cleave amino acids from the C-terminal. A time course must be done to see which amino acid is released first. N-terminal analysis can also be done as part of sequencing the entire protein as discussed below (Edman degradation reaction).
Analysis for Specific Amino Acids
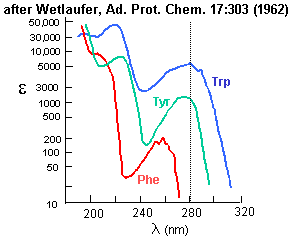
Aromatic amino acids can be detected by their characteristic absorbance profiles. Amino acids with specific functional groups can be determined by chemical reactions with specific modifying groups, as shown in section 2A.
Figure: amino acid absorbance profiles
Amino Acid Sequence - Edman Degradation
Two methods exist to determine the entire sequence of a protein. In one, the protein is sequenced; in the other, the DNA encoding the protein is sequenced, from which the amino acid sequence can be derived. The actually protein can be sequenced by automated, sequential Edman Degradation.
Figure: Edman Degradation
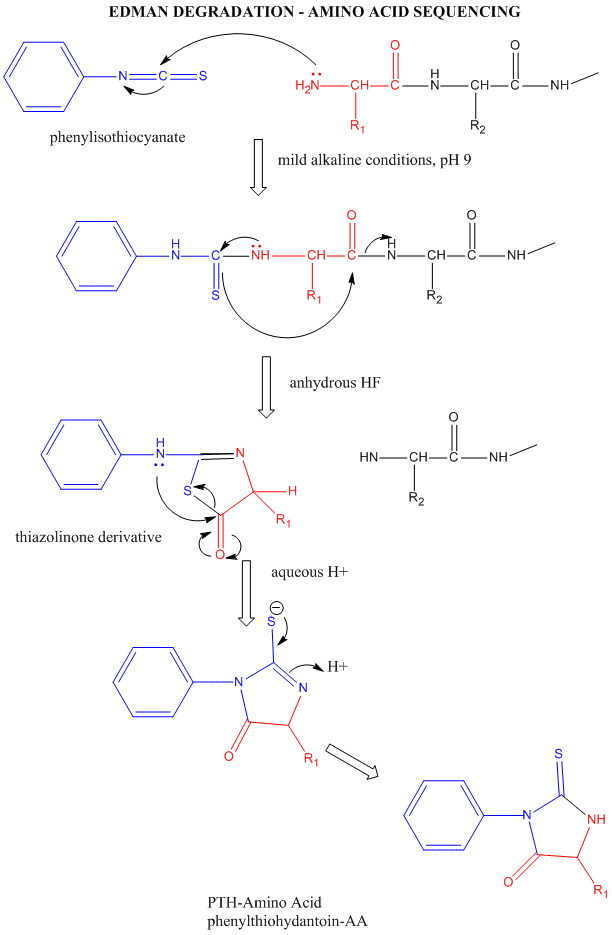
In this technique, a protein adsorbed to a solid phase reacts with phenylisothiocyanate. An intramolecular cyclization and cleavage of the N-terminal amino acid results, which can be washed from the adsorbed protein and detected by HPLC analysis. The yields in this technique are close to 100%. However, with time, more chains accumulate in which an N-terminal amino acid has not been removed. If it is removed on the next step, two amino acids will elute, creating increasing "noise" in the elution step - i.e. more than 1 amino acid derivative will be detected. Hence the maximal length of the peptide which can be sequenced is about 50 amino acids. Most proteins are larger than that. Hence, before the protein can be sequenced, it must be cleaved with specific enzymes called endoproteases which cleave proteins after specific side chains. For example, trypsin cleaves proteins within a chain after Lys and Arg, while chymotrypsin cleaves after aromatic amino acids, like Trp, Tyr, and Phe. Chemical cleavage by small molecules can be used as well. Cyanogen bromide, CNBr, cleaves proteins after methionine side chains. The individual proteins must be cleaved using two different methods, and each peptide fragment isolated and sequenced. Then the order of the cleaved peptides with known sequence can be pieced together by comparing the peptide sequences obtained using different cleavage methods. Many proteins also have disulfide bonds connecting Cys side chains distal to each other in the polypeptide chain. Proteolytic or chemical cleavage of the protein would lead to the formation of a fragment containing two peptides linked by disulfides. Edman degration would release two amino acids from such fragments. To avoid this problem, the protein is oxidized with performic acid, which irreversibly oxidizes free Cys, or Cys-Cys disulfides to cysteic acid residues. A summary of the steps involved in protein sequencing are shown below:
PROTEIN SEQUENCING STRATEGY - 8 STEPS
- If the protein contains more than one polypeptide chain, the chains are separated and purified. If disulfide bonds connect two different chains, the S-S bond must be cleaved (as described in step 2) and each peptide independently purified.
- Intrachain S-S bonds between Cys side chains are cleaved with performic acid. (See above for interchain S-S bonds).
- The amino acid composition of each chain is determined
- The N-terminal and C-terminal residues are identified.
- Each polypeptide chain is cleaved into smaller fragments, and the amino acid composition and sequence of each fragment is determined.
- Step 5 is repeated, using a different cleavage procedure to generate a different and overlapping set of peptide fragments.
- The overall amino acid sequence of the protein is reconstructed from the sequences in overlapping fragments.
- The position of the S-S is located. (See online problem set - Proteins)
B2. Sequence Determination Using Mass Spectrometry
Mass spectrometry is supplanting more tradition methods (see above) as the choice to determine the molecular mass and structure of a protein. Its power comes from its exquisite sensitivity and modern computational methods to determine structure through comparisons of ion fragment data with computer databases of known protein structures. In mass spectrometry, a molecule is first ionized in an ion source. The charged particles are then accelerated by an electric field into a mass analyzer where they are subjected to an external magnetic field. The external magnetic field interacts with the magnetic field arising from the movement of the charged particles, causing them to deflect. The deflection is proportional to the mass to charge ratio, m/z. Ions then enter the detector which is usually a photomultiplier. Sample introduction into the ion source occurs though simple diffusion of gases and volatile liquids from a reservoir, by injection of a liquid sample containing the analyte by spraying a fine mist, or for very large proteins by desorbing a protein from a matrix using a laser. Analysis of complex mixtures is done by coupling HPLC with mass spectrometry in a LCMS.
Ion source: There are many methods to ionize molecules, including atmospheric pressure chemical ionization (APCI), chemical ionization (CI), or electron impact (EI). The most common methods for protein/peptide analyzes are electrospray ionization (ESI) and matrix assisted laser desorption ionization (MALDI).
Electrospray ionization (ESI) - The analyte, dissolved in a volatile solvent like methanol or acetonitrile, is injected through a fine stainless steel capillary at a slow flow rate into the ion source. A high voltage (3-4 kV) is maintained on the capillary giving it a positive charge with respect to the other oppositely charged electrode. The flowing liquid becomes charged with same polarity as the polarity of the positively charged capillary. The high field leads to the emergence of the sample as a charged aerosol spray of charged microdrops which reduces electrostatic repulsions in the liquid. This method essentially uses electrical energy to produce the aerosol instead of mechanical energy to produce a liquid aerosol, as in the case of a perfume atomizer. Surrounding the capillary is a flowing gas (nitrogen) which helps to move the aerosol towards the mass analyzer. The microdrops become smaller in size as the volatile solvent evaporates, increasing the positive charge density on the drops. Eventually electrostatic repulsions cause the drops to explode in a series of steps, ultimately producing analyte devoid of solvent. This gentle method of ionization produces analytes that are not cleaved but ready for introduction into the mass analyzer. Protein emerge from this process with a roughly Gaussian distribution of positive charges on basic side chains. In organic chemistry you studied mass spectrums of small molecules induced by electron bombardment. This produces ions of +1 charge as an electron is stripped away from the neutral molecule. The highest m/z peak in the spectrum is the parent ion or M+ ion. The highest m/z ratio detectable in the mass spectrum is in the thousands. However, large peptides and proteins with large molecular masses can be detected and resolved since the charge on the ions are great than +1. In 2002, John Fenn was awarded a Noble Prize in Chemistry for the development and use of ESI to study biological molecules.
An example of an ESI spectrum of apo-myoglobin is shown below. Note the roughly Gaussian distribution of the peaks, each of which represents the intact protein with charges differing by +1. Protein have positive charges by virtue of both protonation of amino acid side chains as well as charges induced during the electrostray process itself. Based on the amino acid sequence of myoglobin and the assumption that the pKa of the side chains are the same in the protein as for isolated amino acids, the calculated average net charges of apoMb would be approximately +30 at pH 3.5, +20 at pH 4.5, +9 at pH 6, and 0 at pH 7.8 (the calculated pI). The mass spectrum below was taken by direct injection into the MS of apoMb in 0.1% formic acid (pH 2.8). Charges on the peptide are a combined results of charges present on the peptide before the electrospray and changes in charges induced during the process. http://www.chm.bris.ac.uk/ms/theory/esi-ionisation.html. .
Figure: ESI Mass Spectrum of Apo-Myoglobin
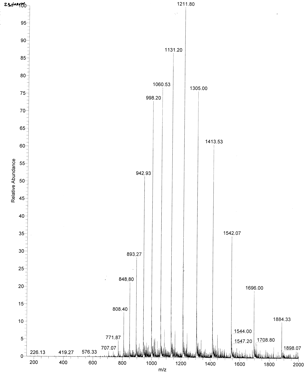
The molecular mass of the protein can be determined by analyzing two adjacent peaks, as shown in the figure below.
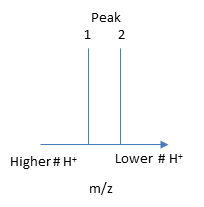
If M is the molecular mass of the analyte protein, and n is the number of positive charges on the protein represented in a given m/z peak, then the following equations gives the molecular mass M of the protein for each peak:
Mpeak2 = n(m/z)peak 2 - n(1.008)
Mpeak1 = (n + 1) (m/z)peak 1 - (n +1) (1.008)
where 1.008 is the atomic weight of H. Since there is only one value of M, the two equations can be set equal to each other, giving:
n(m/z)peak 2 - n(1.008) = (n + 1) (m/z)peak 1 - (n +1) (1.008)
Solving for n gives:
n = [(m/z)peak 1- 1.008]/[(m/z)peak 2 -(m/z)peak 1].
Knowing n, the molecular mass M the protein can be calculated for each m/z peak. The best value of M can then be determined by averaging the M values determined from each peak (16,956 from the above figure). For peaks from m/z of 893-1542, the calculated values of n ranged from +18 to +10.
Matrix assisted laser desorption ionization (MALDI): In this technique, used for larger biomolecules like proteins and polysaccharides, the analyte is mixed with an absorbing matrix material. Laser excitation is used to excite the matrix, leading to energy transfer that results in ionization and "launching" of the matrix and analyte in ion form from the solid mixture. Parent ion peaks of (M+H)+ and (M-H)- are formed.
Mass Analyzer:
Quadrupole ion trap (used in ESI) - A complex mixture of ions can be contained (or trapped) in this type of mass analyzer. Two common type are linear and 3D quadrupoles.
Figure: Linear and 3D Quadrupoles
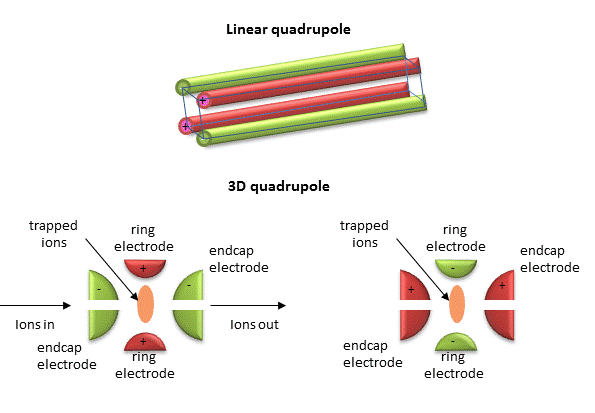
As dipoles display positive and negative charge separation on a linear axis, quadrupoles have either opposite electrical charges or opposite magnetic fields at the opposing ends of a square or cube. In charge separation, the monopole (sum of the charges) and dipoles cancel to zero, but the quadrupole moment does not. The quadrupole traps ions using a combination of fixed and alternating electric fields. The trap contains He at 1 mTorr. For the 3D trap, The ring electrode has a oscillating RF voltage which keeps the ions trapped. The end caps also have an AC voltage. Ions oscillate in the trap with a "secular" frequency determined by the frequency of the RF voltage, and of course, the m/z ratio. By increasing the the amplitude of the RF field across the ring electron, ion motion in the trap becomes destabilized and leads to ion ejection into the detector. When the secular frequency of ion motion matches the applied AC voltage to the endcap electrodes, resonance occurs and the amplitude of motion of the ions increases, also allowing leakage out of the ion trap into the detector.
-
 Ion
Trap Animation (requires download) from Thermo Scientific
Time of Flight (TOF) tube (used in MALDI) - a long tubes is used and the time required for ion detection is determined. The small molecular mass ions take the shortest time to reach the detector.
Tandem Mass Spectrometry (MS/MS): Quadrupole mass analyzers which can select ions of varying m/z ratios in the ion traps are commonly used in for tandem mass spectrometry (MS/MS). In this technique, the selected ions are further fragmented into smaller ions by a process called collision induced dissociation (CID). When performed on all of the initial ions present in the ion trap, the sequence of a peptide/protein can be determined. This techniques usually requires two mass analyzers with a collision cell in-between where selected ions are fragmented by collision with an inert gas. It can also be done in a single mass analyzer using a quadrupole ion trap.
In a typical MS/MS experiment to determine a protein sequence, a protein is cleaved into protein fragments with an enzyme such as trypsin, which cleaves on carboxyl side of positively charge Lys and Arg side chains. The average size of proteins in the human proteome is approximately 50,000. If the average molecular mass of an amino acid in a protein is around 110 (18 subtracted since water is released on amide bond formation), the average number of amino acids in the protein would be around 454. If 10% of the amino acids are Arg and Lys, the on average there would be approximately 50 Lys and Arg, and hence 50 tryptic peptides of average molecular mass of 1000. The fragments are introduced in the MS where a peptide fragment fingerprint analysis can be performed. The MWs of the fragments can be identified and compared to known peptide digestion fragments from known proteins to identify the analyte protein.
To get sequence information, a tryptic peptide with a specific m/z ratio (optimally with a single +1 charge) is further selected in the ion trap and fragmented on collision with an inert agent (MS/MS). Since the m/e range of mass spectrometers is in the thousands, tryptic fragments with a single charge can easily be detected and targeted for MS/MS. The likely and observed cleavages for a tetrapeptide and the resulting ions with a +1 charge are illustrated below. Ions with the original N terminus are denoted as a, b, and c, while ions with the original C terminus are denoted as x, y, and z. c and y ions gain an extra proton from the peptide to form positively charged -NH3+ groups. The actual ions observed depend on many factors including the sequence of the peptide, its original charge, the energy of the collision inducing the fragmentation, etc. Low energy fragmentation of peptides in ion traps usually produce a, b, and y ions, along with peaks resulting from loss of NH3 (a*, b* and y*) or H2O (ao, bo and yo). No peaks resulting from fragmentation of side chains are observed. Fragmentation at two sites in the peptide (usually at b and y sites in the backbone) form an internal fragment.
Figure: Peptide Fragmentation and Sequencing by MS/MS
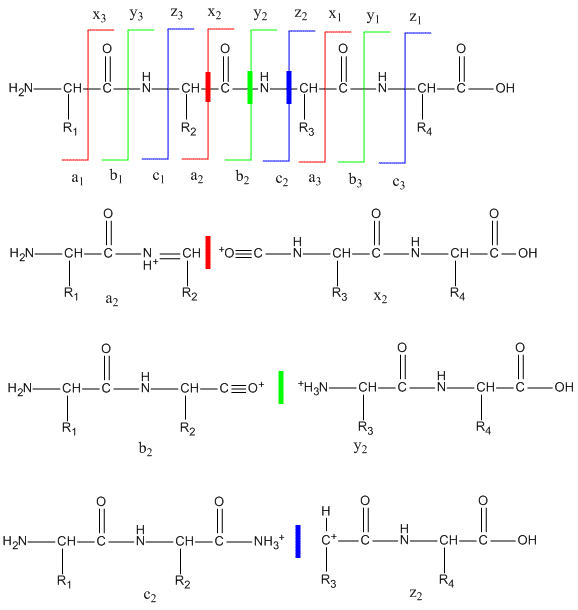
The y1 peak represents the C-terminal Lys or Arg (in this example) of the tryptic peptide. Peak y2 has one addition amino acid compared to y1 and the molecular mass difference identifies the extra amino acid. Peak y3 is likewise one amino acid larger than y2. All three y fragments peaks have a common Lys/Arg C-terminal and the charged fragment contains the C-terminal end of the original peptide. All b fragment peaks for a given peptide contain a common N terminal amino acid with b1 the smallest. Note that the subscript represents the number of amino acids in the fragment. By identifying b and y peaks the actual sequence of small peptide can be determined. Usually spectra are match to databases to identify the structure of each peptide and ultimately that of the protein. The actual m values for fragments can be calculated as follows, where (N is the molecular mass of the neutral N terminal group, (C) is the molecular mass of the neutral c terminal group, and (M) is the molecule mass of the neutral amino acids.
- a: (N)+(M)-CHO
- b: (N)+(M)
- y: (C)+(M)+H (note in the figure above that the amino terminus of the y peptides has an extra proton in the +1 charged peptides.)
m/z values can be calculated from the calculated m values and by adding the one H mass to the overall z if the overall charge is +1, etc.
Table: Masses of amino acid residues in a protein.
(For N terminal amino acid, add 1 H. for C terminus add OH)
|
Residue |
Code |
Monoisotopic Mass |
Average Mass |
|
Ala |
A |
71.03714 |
71.0779 |
|
Arg |
R |
156.101111 |
156.1857 |
|
Asn |
N |
114.042927 |
114.1026 |
|
Asp |
D |
115.026943 |
115.0874 |
|
Cys |
C |
103.009185 |
103.1429 |
|
Glu |
E |
129.042593 |
129.114 |
|
Gln |
Q |
128.058578 |
128.1292 |
|
Gly |
G |
57.021464 |
57.0513 |
|
His |
H |
137.058912 |
137.1393 |
|
Ile |
I |
113.084064 |
113.1576 |
|
Leu |
L |
113.084064 |
113.1576 |
|
Lys |
K |
128.092963 |
128.1723 |
|
Met |
M |
131.040485 |
131.1961 |
|
Phe |
F |
147.068414 |
147.1739 |
|
Pro |
P |
97.052764 |
97.1152 |
|
Ser |
S |
87.032028 |
87.0773 |
|
Thr |
T |
101.047679 |
101.1039 |
|
Trp |
W |
186.079313 |
186.2099 |
|
Tyr |
Y |
163.06332 |
163.1733 |
|
Val |
V |
99.068414 |
99.1311 |
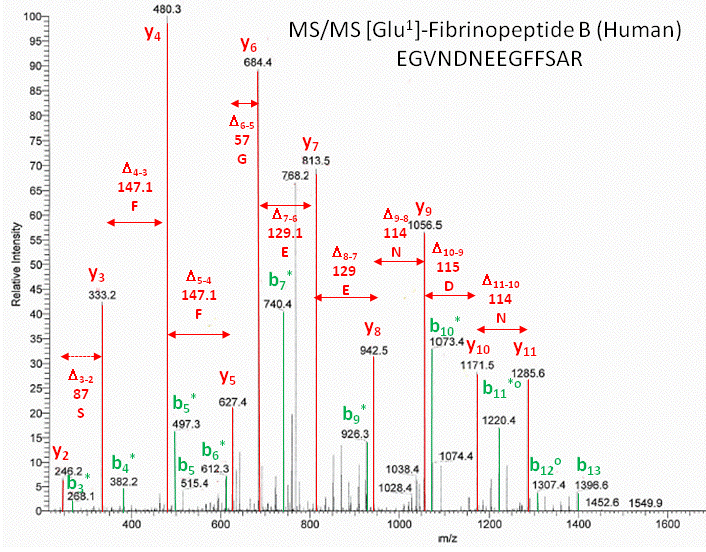
As an example, sing these MW values, the sequence of the human Glu1- fibrinopeptide B can be determined from MS/MS spectra shown in an annotated form below. Note that most of the b peaks are b* resulting from lost of NH3 from the N terminus.
Figure: Annotated MS/MS spectra of human Glu1- fibrinopeptide B
-
 MS
review from Organic Chemistry
 -
 Mass
Spectroscopy Educational Resources
 -
 Mass
Spec Resources
 -
 Sequence
Determination: Animation
 -
 An
Introduction to Mass Spectrometry
 -
 Ion
Traps
 -
 What
is electrospray?
 -
 Protein
Prospector: Proteomics tools for mining sequence databases in
conjunction with Mass Spectrometry experiments
 -
 Proteomics
Research for Integrative Biology
 -
 Mascot
from Matrix Science: a powerful search engine which uses mass
spectrometry data to identify proteins from primary sequence databases
 -
 Peptide
Mass Fingerprinting: A tutorial
B3. Levels of Protein Structure
A protein can be considered to have primary, secondary, tertiary, and quaternary structures.
- primary structure: the linear amino acid sequence of a protein
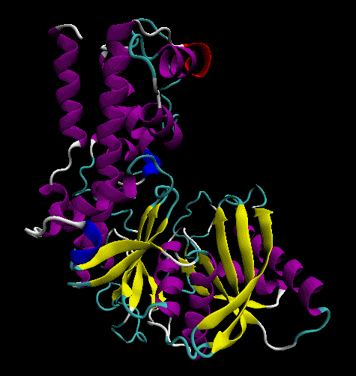
- secondary structure: regular repeating structures arising when hydrogen bonds between the peptide backbone amide hydrogens and carbonyl oxygens occur at regular intervals within a given linear sequence (strand) of a protein (as in the alpha helix) or between two adjacent strands (as in beta sheets and reverse turns)
Figure: Secondary Structure (purple -alpha helices, yellow - beta strands. Image made with VMD)
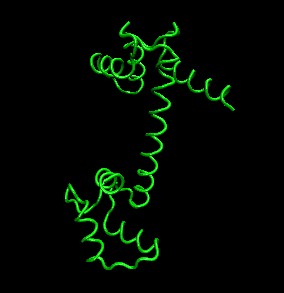
- tertiary structure: the overall three dimensional shape of a protein, often represented by a backbone trace
Figure: tertiary structure (calmodulin - image made with VMD)
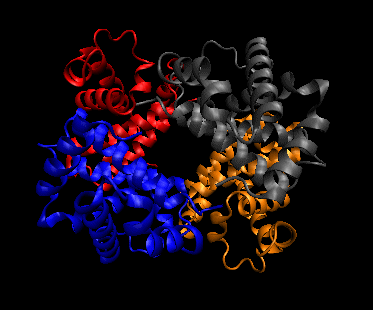
- quaternary structure: oligomeric structure of a multisubunit protein in which separate proteins chains associate to form dimers, trimers, tetramers, and other oligomers. The different chains in the oligomers may be the same protein (homooligomers) or a combination of different protein chains (heteroliogomers). The different chains within the oligomer may be held together by noncovalent intermolecular forces or may also contain covalent interchain disulfides.
Figure: Quaternary structure (4 chains of hemoglobin - Image made with VMD)
B4. Analysis of Protein Secondary Structure
The percent and type of secondary structure can be determined using circular dichroism (CD) spectroscopy. (The links below come from an animated tutorial on Electromagnetic Waves and Circular Dichroism by Andr�s Szil�gyi ) In this method, right and left circularly polarized light illuminates a protein, which, since it is made of all L-amino acids, is chiral. (The mirror image would be a protein of the same sequence made of D-amino acids.) Circularly polarized light can be made when plane polarized light of the same amplitude and wavelength meet out of phase. If R and L circularly polarized light of the same wavelength and amplitude are passed through an optically inactive medium, the two waves combine (vectorially) to produce plane polarized light. Optical activity is observed only when the environment in which a transition occurs is asymmetric.
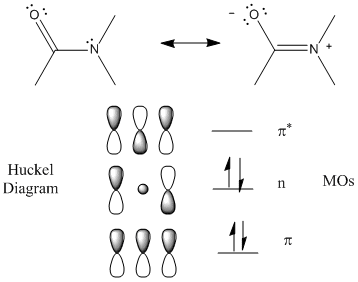
The peptide (amide) bond absorbs UV light in the range of 180 to 230 nm (far-UV range) so this region of the spectra give information about the protein backbone, and more specifically, the secondary structure of the protein. The main transitions are n --> p * at 220 nm and p --> p * at 190 nm. There is a little contribution from aromatic amino acid side chains but it is small given the large number of peptide bonds. The lone pair on N adjacent to the pi bond can be considered to be rehybrized to sp2 from sp3 allowing for conjugation of the p electrons (which lowers the energy of the electrons). The Huckel diagram below shows 3 MOs generated form the 3 atomic p orbitals. The middle one (with 1 node) has energy similar to the separate atomic p orbtials and is considered a nonbonding MO (consistent with the lone nonbonding pair on the N atom).
Figure: Peptide Bonds - MOs and Huckel Diagram
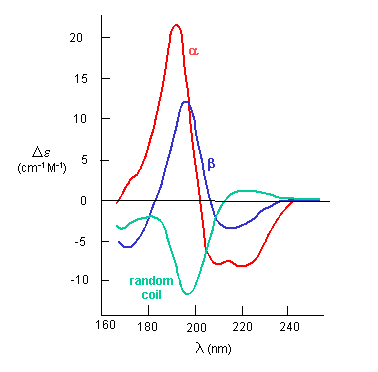
The peptide bonds in a protein's asymmetric environment will absorb this range of light (promoting electrons to higher energy levels). In different secondary structures , the peptide bond electrons will absorb right and left circularly polarized light differently (for example, they have different molar absorptivities). Hence a, b and random coil structures all have distinguishable far UV CD spectra.
Stated in another way, if plane polarized light, which is a superposition of right and left circularly polarized light, passes through an asymmetric sample which absorbs right and left circularly polarized differently (i.e they display circular dichroism), then the light passing through the sample after vector addition of the right and left hand circularly polarized light gives elliptically polarized light. (Great link!) The
If the chiral molecules also have a different index of refraction for R and L circularly polarized light, an added net effect is rotation of the angle of the ellipitically of the polarized light. The far-UV CD spectrum of the protein is sensitive to the main chain conformation. The CD spectra of alpha and beta secondary structure are shown in the figure below.
Figure: The CD Spectra of Alpha-Helix, Beta-Sheet, and Random Coils
Protein side chains also find themselves in such an asymmetric environment. If irradiated with circularly polarized UV light in the range of 250-300 nm (near UV), differential absorption of right and circularly polarized light by the aromatic amino acids (Tyr, Phe, Trp) and disulfide bonds occur and a near UV CD spectra result. If the near UV CD spectra of a protein is taken under two different sets of conditions, and the spectra differ, then it can be surmised that the environment of the side chains is different, and hence the proteins have somewhat different conformations. It will not give information about secondary structure of the backbone since that requires lower wavelengths for absorption of occur. Rather it can show differences in tertiary structure.
-
 CD
Spectroscopy - web tutorial
B5. Analysis of Protein Tertiary Structure
Clearly, the highest resolution understanding of protein structure requires a solution to the 3D structure of the protein. Once that is determined, it is easy to devise computer programs which will determine what part of the structure is in secondary structure. Three methods are presently useful to determine the 3D structures of proteins.
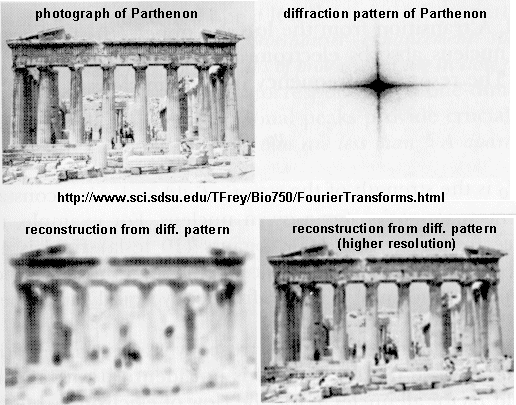
A. X-Ray crystallography: If crystals of the protein can be made, traditional x-ray crystallographic techniques can be used to solve the structure. X-rays irradiate a crystal, which scatters the x-rays, leading to constructive/destructive interference patterns. Using appropriate math, the interference pattern can be reconverted into the actual structure of the protein. Check out a fun example showing such a reconstruction of the Parthenon from its diffraction pattern!
These structures are not solution structures, but overwhelming evidence suggest that they do represent the solution structure. For instance, x-ray structure contain many water molecules which interact with each other and the protein, a finding expected for a structure that represents the solution structure of the protein. In addition, substrates and inhibitors can be infused into the crystal and bind with the protein, suggesting again a native-like structure for the protein in the crystal.
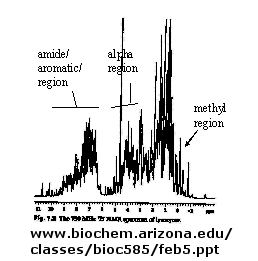
B. NMR: There are many protons in proteins which give a proton NMR spectra. The problem is one of assignment, since there are so many. Nuclei in different environments absorb energy at different resonant frequencies. When a proton spin flips, it goes to a higher energy state. It will return to the equilibrium state with some time delay.
Figure: 1D NMR spectra of a protein
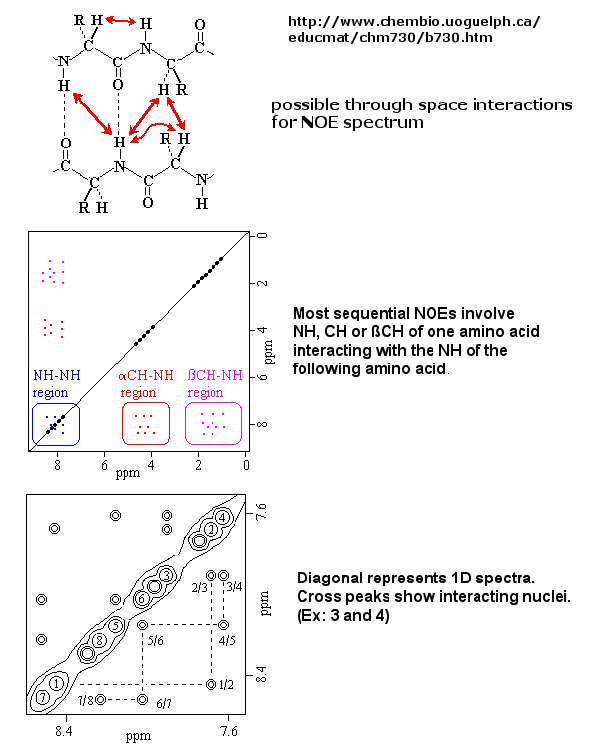
If an unexcited proton is proximal in space, the magnetization can be transferred to the unexcited proton. This interaction is inversely proportional to the 6th power of the distance between them and is the basis of the Nuclear Overhauser Effect (NOE). A 2D NOE spectra shows peaks off the diagonal that are correlated, indicated that they are close in 3D space.
Figure: 2D NOSEY spectra of a protein
Multi-dimensional techniques, obtained when isotopes of N(15) and C(13) are present in the protein, can be used to actually obtain a 3D solution of a small protein. NMR and X-ray structure of the protein are almost superimposable.
Figure: NMR Structure of Proteins
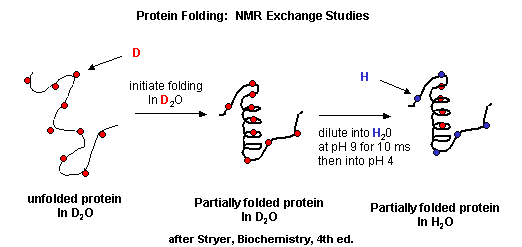
- Start2Fold: Database of hydrogen/deuterium exchange data on protein folding and stability Great link to visualize D2O folding data. TBA
-
 basic
NMR review
 -
 protein
NMR
 -
 Structure
Determination of Proteins with NMR Spectroscopy. (including 1, 2,
and 3 D)
 -
 2D
NMR
C. Homology Modeling: The structure of unknown proteins can be modeled theoretically if they have extensive sequence homology to another protein whose structure is known.
- homology modeling : general description
- homology modeling for beginners: a course
- an automative comparative protein modeling server - from the The ExPASy (Expert Protein Analysis System) proteomics server of the Swiss Institute of Bioinformatics (SIB)
- comparative protein modeling from ExPASy.
Of course, to characterize proteins rigorously, they must be purified from a solution containing many proteins. We will cover these techniques in the laboratory. Here is a quick summary of some of them:

Biochemistry Online by Henry Jakubowski is licensed under a Creative Commons Attribution-NonCommercial 4.0 International License.