NMR9. Integration
There is additional information obtained from 1H NMR spectroscopy that is not typically available from 13C NMR spectroscopy. Chemical shift can show how many different types of hydrogens are found in a molecule; integration reveals the number of hydrogens of each type.
Looking at the spectrum of ethanol, you can see that there are three different kinds of hydrogens in the molecule. You can also see by integration that there are three hydrogens of one type, two of the second type, and one of the third type -- corresponding to the CH3 or methyl group, the CH2 or methylene group and the OH or hydroxyl group. That information helps narrow down the number of possible structures of the sample, and so it makes structure elucidation of an unknown sample much easier.
- integration reveals the ratio of one type of hydrogen to another within a molecule.
Integral data can be given in different forms. You should be aware of all of them. In raw form, an integral is a horizontal line running across the spectrum from left to right. Where the line crosses the frequency of a peak, the area of the peak is measured. This measurement is shown as a jump or step upward in the integral line; the vertical distance that the line rises is proportional to the area of the peak. The area is related to the amount of radio waves absorbed at that frequency, and the amount of radio waves absorbed is proportional to the number of hydrogen atoms absorbing the radio waves.
The following spectrum was recorded with a sample of ethanol in deuterochloroform (CDCl3). Ethanol has the condensed formula CH3CH2OH. Its 1H NMR spectrum should reflect a 3:2:1 ratio of hydrogens.
Figure NMR9.1.1H NMR spectrum of ethanol with solid integral line.1
Those ratios are shown by the height that the blue integral line "hops" or "steps" as it passes each peak. There are three peaks in ethanol: a sharp peak near 4 ppm, a little blob near 1.5 ppm and another sharp peak near 1 ppm. The first step in the integral line, near 4 ppm, is pretty big. The second step, near 1.5 ppm, is only about half as big as the first one. The third step, near 1 ppm, looks a little bigger than the first. Without getting out a ruler, it's hard to judge exactly how big, but maybe it's 1.5 times bigger than the first.
That means the ratio of these peaks is 1:0.5:1.5. That's the same thing as a 2:1:3 ratio. We are probably looking at, from left to right, the CH2, the OH and the CH3 in the ethanol.
We'll get back to looking at that ratio within ethanol in a moment. Meanwhile, it's worth noting that there is an additional, small peak in the spectrum near 7.25 ppm. That's a little bit of regular chloroform, CHCl3, in the CDCl3 solvent used for the NMR spectrum. You might imagine that it's pretty difficult to separate two compounds that differ from each other only by the presence or absence of one neutron. Consequently, there is always a tiny amount of CHCl3 in a bottle of CDCl3. But why is that peak so tiny? And why does the integral line barely budge upwards as it passes over the peak? If there is one H in CHCl3, should its integral match the 1H in ethanol?
Let's get back to the ethanol spectrum and look at some different ways in which we can view the integration. Sometimes, the integral line is cut into separate integrals for each peak so that they can be compared to each other more easily.
Figure NMR9.2.1H NMR spectrum of ethanol with broken integral line.1
In the picture above, it's easier to see the 2:1:3 ratio between the peaks.
Often, instead of displaying raw data, the integrals are measured and their heights are displayed on the spectrum.
Figure NMR9.3.1H NMR spectrum of ethanol with numerical integrals.1
The numbers under the spectrum read, from left to right, 29.76, then 14.99 and finally 53.48. Roughly, these numbers are 30:15:54. That's close to a 2:1:3 ratio, although 30:15:45 would be an even better fit. Note that the numerical printout we get does not exactly match the ratio we expect; in fact, it seems a little worse than the ratio we roughly estimated by eye. That's because it really is worse than the ratio we roughly measured by eye.
When you compared the integrals by eye, you were looking at an entire blue integral line and comparing it to another entire blue integral line. You were performing what is called "mulivariable analysis". Each integral line is composed of dozens or hundreds of data points. Your brain takes in all of that information and weighs it carefully to come up with an idea of how high the integral steps as it passes a peak.
It's hard to find NMR software that will perform this analysis as well as you can. It may come up with much more precise numbers than you can, but it's numbers are less trustworthy than yours. That's because the computer is just doing a two-data-point analysis; it measures the change in y coordinate from the beginning of the blue line to the end of the blue line. It's still useful, but keep in mind that it won't be dead on, especially if the ends of the integral line are tilted.
Sometimes the heights are "normalized". They are reduced to a lowest common factor so that their ratios are easier to compare. These numbers could correspond to numbers of hydrogens, or simply to their lowest common factors. Two peaks in a ratio of 1H:2H could correspond to one and two hydrogens, or they could correspond to two and four hydrogens, etc.
Figure NMR9.4.1H NMR spectrum of ethanol with normalized integral numbers.
Note that the ratio is nothing like a comparison of the heights of the peaks. If we were to just estimate the heights of the peaks, we might come up with something like 1:0.1:3 or 10:1:30. The integrals are measuring the total area of the peak, so the width of the peak matters as well as its height.
Problem NMR9.1.
Because the 1H NMR spectrum has relatively low resolution, the spectra of saturated, straight-chain hydrocarbons are all similar: a peak for the methyl hydrogens at 0.9 ppm and a peak for the methylene (CH2) hydrogens at 1.0 ppm. However, different hydrocarbons can be identified by their integration values.
Predict the integrations for the following compounds:
a) pentane b) octane c) decane d) heptane e) hexane
Problem NMR9.2.
Sketch a predicted NMR spectrum for each of the following compounds, with an integral line over each peak.
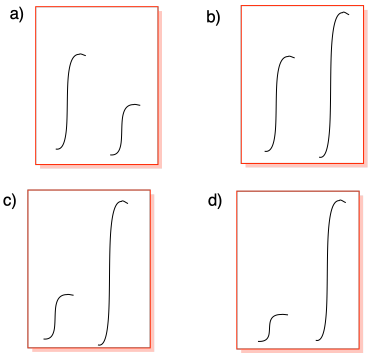
Problem NMR9.3. Indicate the ratio between integral in each of the cases below.
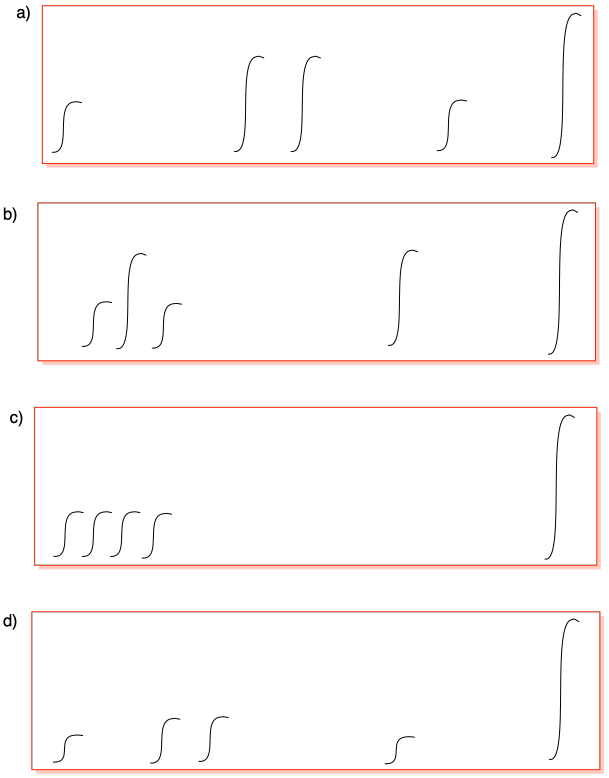
Problem NMR9.4. Indicate the ratios between integral in each of the cases below.
Problem NMR9.5. Measure the integrals in the following compounds. Given the integral ratios and chemical shifts, can you match each peak to a set of protons?