NMR8. Chemical Shift in Proton Spectra
The 1H NMR spectrum typically covers a frequency range of approximately 0-10 ppm. Some acidic hydrogen nuclei, or protons, show up a little beyond 10 ppm, usually between 10-12 ppm. They can show up even farther beyond that, or "further downfield", under special circumstances, but you aren't likely to see these cases. Protons can also show peaks at frequencies below 0 ppm, or "further upfield", in situations that you are probably not going to see at this level.
Within that roughly 10 ppm range, it can be helpful to think of peaks falling in two ranges: 0-5 ppm and 5-10 ppm. These two halves of the spectrum reveal the environment in which the proton is found. In organic compounds, hydrogens are most often attached to carbons. The most common shapes of carbon atoms in nature are tetrahedral, with four single bonds, and trigonal planar, with two single bonds and a double bond. Tetrahedral carbons are sometimes described as sp3, carbons, indicating the atomic orbitals needed to bond with four atoms at the corners of a three-dimensional tetrahedron (one s and three p orbitals). Trigonal planar carbons are sometimes described as sp2 carbons, describing the atomic orbitals needed to bond with three atoms in a two-dimensional trigonal plane (one s and two 2 p orbitals). Hydrogens attached to sp3 carbons generally show up between 0-5 ppm. Hydrogens attached to sp2 carbons generally show up between 5-10 ppm.
- hydrogens on sp3 carbons usually show up in the upfield half of the spectrum, about 0 to 5 ppm.
- hydrogens on sp2 carbons usually show up in the downfield half of the spectrum, about 5 to 10 ppm.
Electronegativity is a second major factor that controls where protons absorb in the NMR spectrum. Generally, a nearby electronegative atom moves the absorption further downfield. That is, the peak moves to the left, to a higher frequency. The absorption frequency depends on the amount of electron density around the hydrogen atom. The less electron density there is, the higher the absorption frequency. Higher electron density moves the absorption frequency upfield.
- within these two halves of the spectrum, electronegative atoms attached to the same carbon as a proton will draw that proton downfield.
- protons move to higher frequency (downfield) as they develop partial positive charge.
- protons move to lower frequency (upfield) as they develop partial negative charge.
Usually, the geometry factor is a little more important than the electronegativity factor. Peaks may move to the left if there is an electronegative atom near the proton, but they usually remain in the expected half of the spectrum. Occasionally, a proton will spill out of its half. One example is the hydrogen in chloroform, CHCl3, which shows up just downfield of 7 ppm (7.26 ppm if the sample is dissolved in CDCl3 solvent) because of those three very electronegative chlorine atoms. Electronegativity effects are additive, so for comparison, the protons in CH2Cl2 show up closer to 5 ppm (5.32 ppm in CDCl3). CDCl3is frequently used as a solvent and it usually contains traces of CHCl3 (D just stands for deuterium, 2H, another isotope of hydrogen), so a small peak at 7.26 ppm is pretty common in NMR spectra.
The trends here are exactly the same as in carbon spectra, if you have already seen 13C NMR spectrscopy. Wherever the carbon goes, it takes the proton with it. Proton spectra are only around 10 ppm wide, compared to the 200 ppm of carbon spectra, so the numbers are not the same, but the general trends are.
So, in the spectrum of hexane (CH3CH2CH2CH2CH2CH3) all of the hydrogens are on sp3 or tetrahedral carbons. They all show up below 5 ppm. There are no electronegative atoms around, so they are even further upfield, at 1 ppm.
Figure NMR8.1. Simulated 1H NMR spectrum of hexane.
Those peaks fall well within the expected window of 0-5 ppm. One peak is around 0.85 ppm and the other is near 1.35 ppm. Sometimes it can be useful to think of 1 ppm as the approximate default position of a hydrogen on an sp3 carbon. Other factors, such as electronegativity, can pull the peak further downfield.
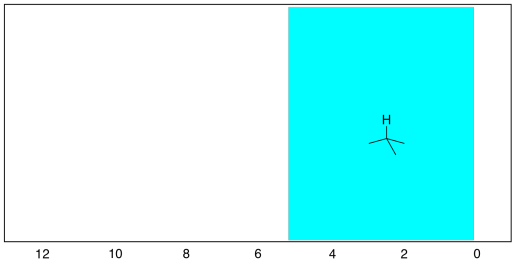
Figure NMR8.2. Chart showing the expected range of protons attached to sp3 carbons in the 1H NMR spectrum.
The more electronegative the neighbour of the carbon on which the proton is sitting, the further the proton will be shifted to the left in the spectrum. Starting from that "default" position of 1 ppm, a nitrogen moves a hydrogen peak about 1 ppm downfield, to about 2.2 ppm. A more electronegative oxygen moves the peak about 2.5 ppm downfield from that default position, somewhere between 3 and 4 ppm. Occasionally, you may see an older spectrum with a small peak at 0 ppm. People used to add a small amount of (CH3)3Si (tetramethylsilane or TMS) to NMR samples. Because silicon is less electronegative than carbon, the hydrogens in this compound are a little more electron-rich than usual, causing the peak to move upfield.
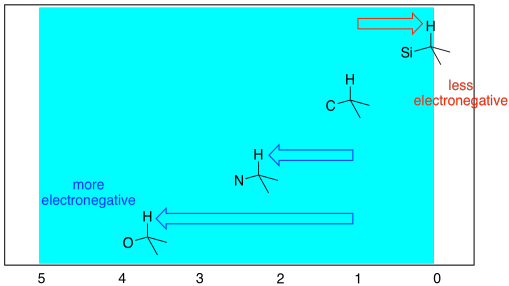
Figure NMR8.3. Chart showing the expected range of protons attached to sp3 carbons in the 1H NMR spectrum.
If we look at 1-hexene (CH2=CHCH2CH2CH2CH3), we see a similar spectrum, but two of the peaks show up above 5 ppm. These hydrogens are on sp2 or trigonal planar carbons. There are other, more subtle changes, but that is the main one.
Figure NMR8.4. Simulated 1H NMR spectrum of 1-hexene.
Those two new peaks for the hydrogens on sp2 carbons fall right around where we would expect them. They are in the left-hand half of the spectrum, around 5 and 6 ppm. The other peaks are between 0.9 and 2.2 ppm, well within the 0-5 ppm range of hydrogens on sp3 carbons.
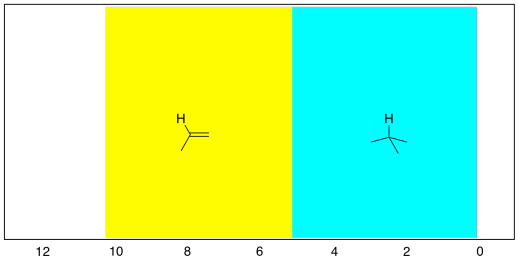
Figure NMR8.5. Chart showing the expected range of protons attached to sp2 and sp3 carbons in the 1H NMR spectrum.
Again, it can be useful to think of 1 ppm as the default position for a proton on a tetrahedral carbon, and to think of the effects of other groups as moving the peak a certain distance away from that starting point. We saw before that a neighbouring oxygen atom moves the peak 2.5 ppm to the left. Thinking of it that way helps you predict what will be the effect of two different attached groups. For example, if there were two oxygens attached to the carbon on which the proton is sitting, it would move 5 ppm, and end up at 6 ppm overall.
In addition, there are more subtle effects of having sp2 carbon neighbours nearby. That's because of the effect that the magnetic field has on the electrons in the double bond. The electrons in the double bond modify the magetic field slightly, moving the nearby hydrogens downfield.
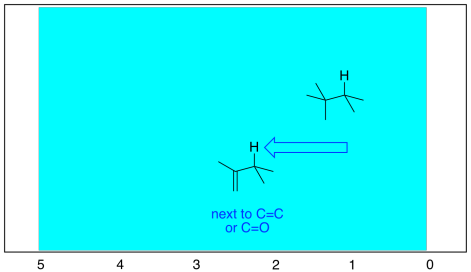
Figure NMR8.6. The effect of an adjacent double bond.
We see similar trends in the left-hand, downfield, sp2 region. If we look at butanal (CH3CH2CH2CHO), we also have several hydrogens on sp3 carbons and one on an sp2 carbon. The former show up below 5 ppm and the latter above 5 ppm. This time, that peak is way downfield at 10 ppm. That hydrogen is on a carbonyl carbon; being double bonded to an oxygen deshields the carbon, and its partner hydrogen a lot.
Figure NMR8.7. Simulated 1H NMR spectrum of butanal.
Sometimes there are also hydrogens on linear or sp carbons, although they are much less common than tetrahedral or trigonal carbons. These peaks overlap with the regions for sp2 and sp3 hydrogens, especially the latter. They can be seen between 2 and 6 ppm, but most often between 2 and 3 ppm.
- hydrogens on sp carbons show up between 2 and 6 ppm, and most often between 2 and 3 ppm.
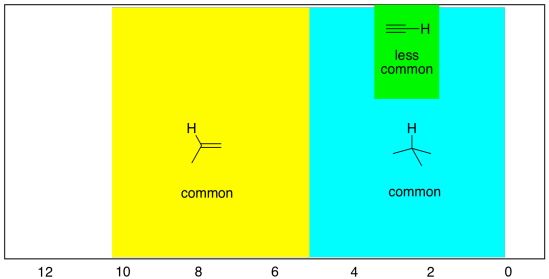
Figure NMR8.8. The most common shift region for a proton on an sp carbon (inset).
In the simulated spectrum below, the proton on the sp carbon in propyne shows up right at 2 ppm.

Figure NMR8.9. Simulated 1H NMR spectrum of propyne, CH3CCH.
There is another complication in the chemical shifts seen in 1H spectroscopy, and that is the behaviour of protons attached directly to heteroatoms such as oxygen and nitrogen. Oxygen is very electronegative, and hydrogen is not, so it stands to reason that an OH proton would absorb at very low field, say 10 ppm. That can sometimes be true: the proton in a carboxylic acid, if it can be seen in the spectrum at all, generally shows up around 12 ppm. However, the proton in water is usually around 1.5 ppm. In fact, protons on OH groups in slightly different situations cover the entire range of the proton spectrum.. OH protons in aliphatic alcohols show up between 2 and 6 ppm, phenolic OH protons between 5 and 9 ppm, and carboxylic acid OH protons between 11 and 12 ppm. Water shows up around 1.6 ppm when dissolved in chloroform, but if the water is present in high concentrations it can show up further downfield. It can also show up at different positions depending on the solvent that the sample is dissolved in.
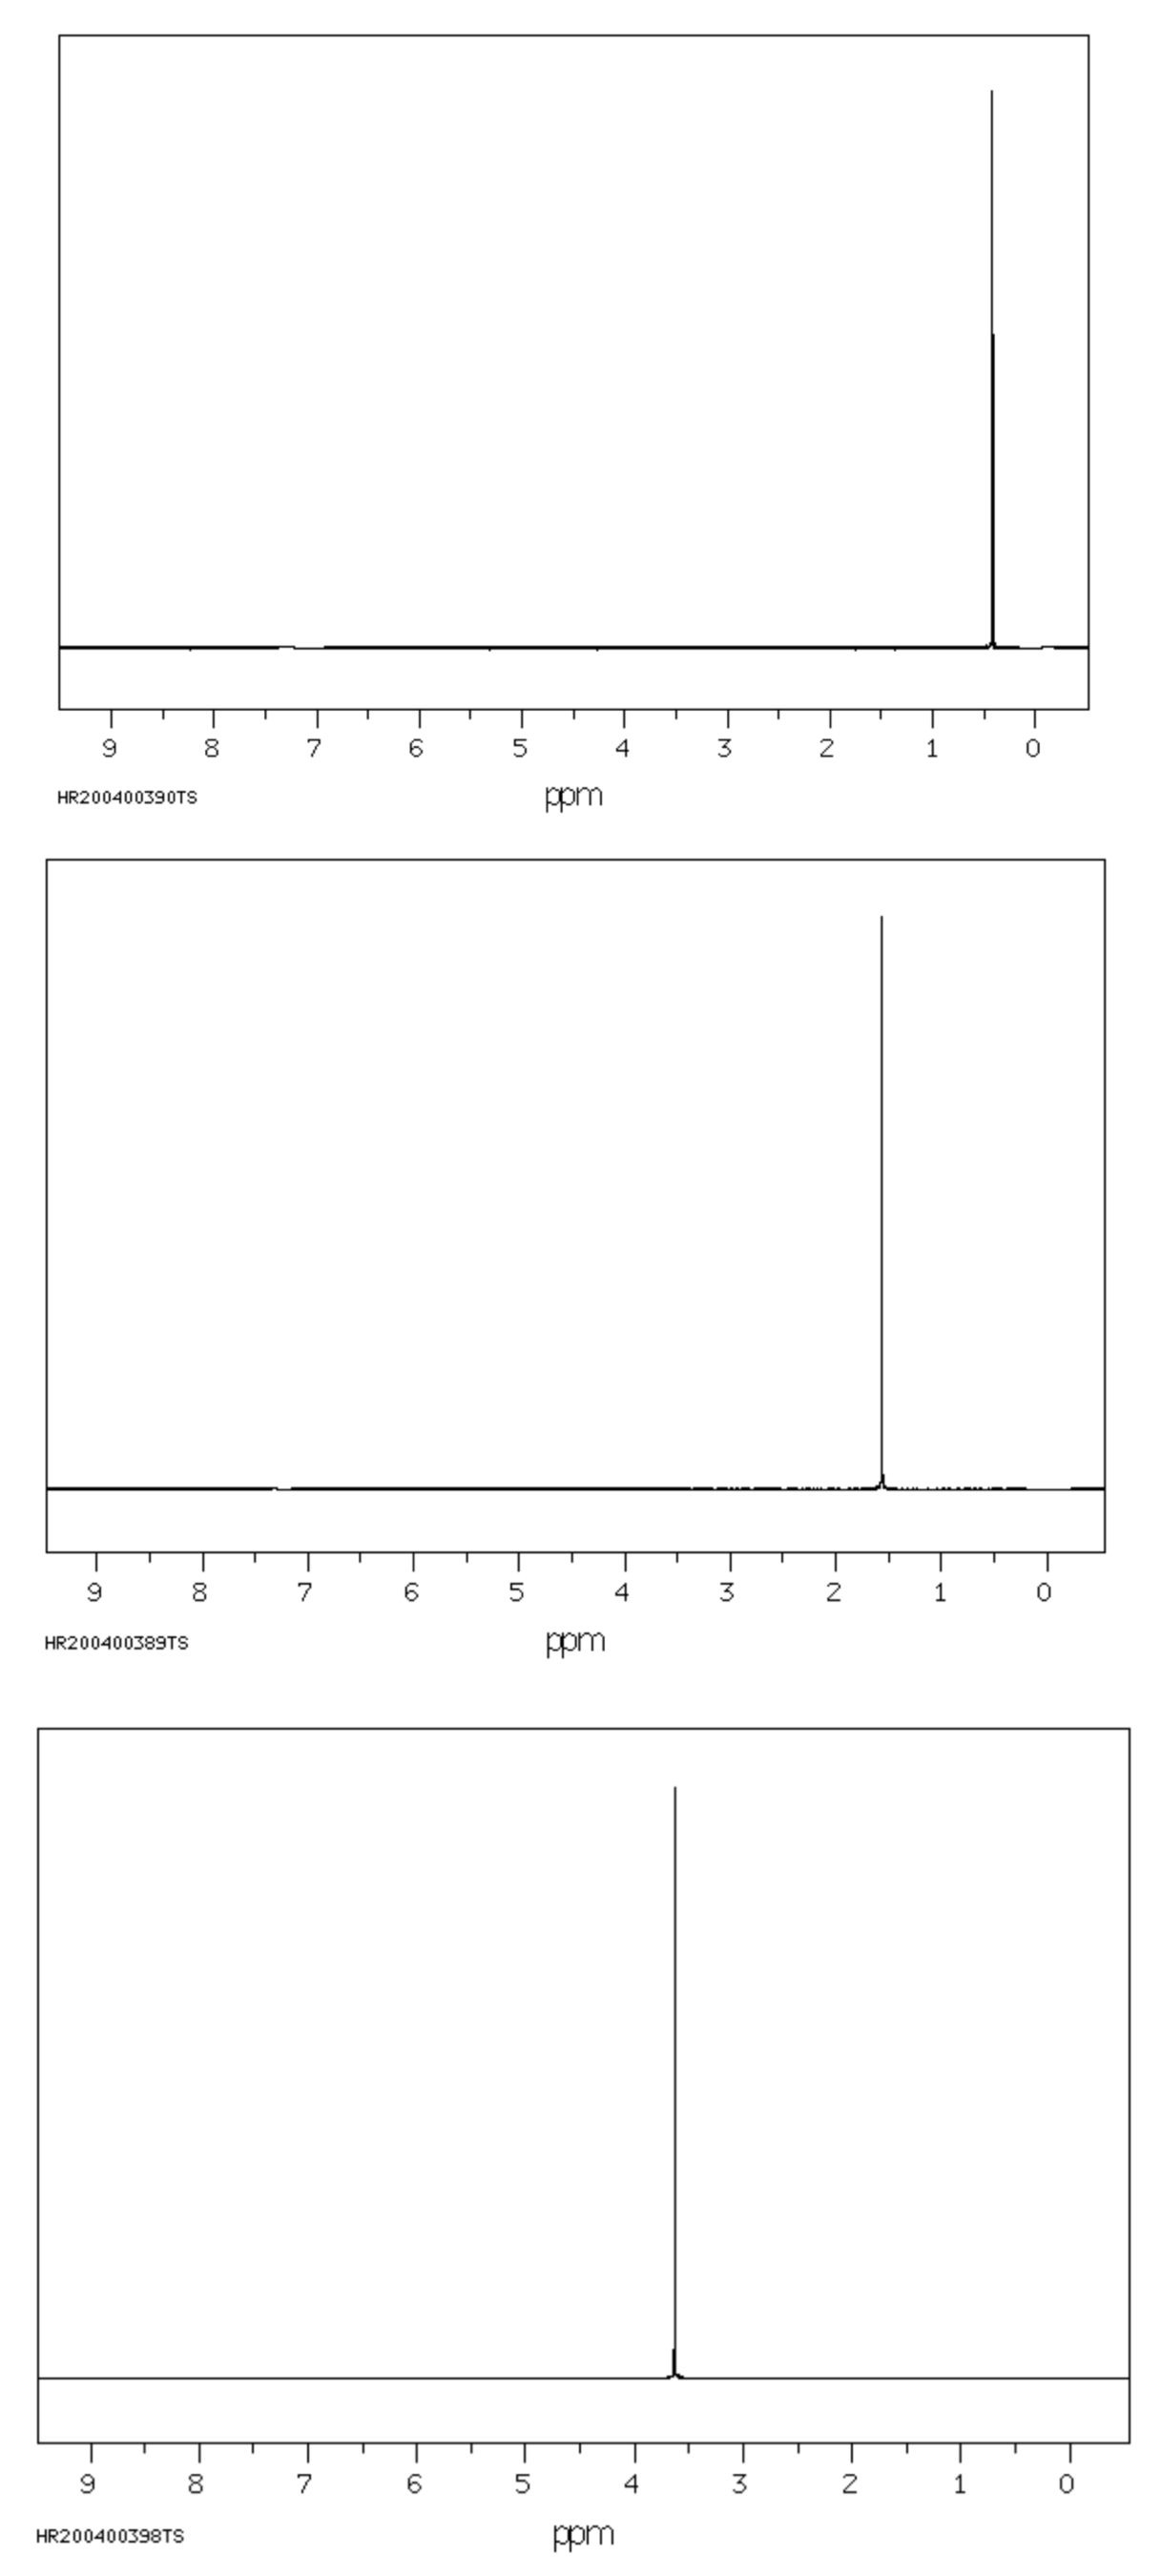
Figure NMR8.10. 1H NMR spectra of water in benzene (top), chloroform (middle) and dimethylsufoxide (bottom).
The exact same molecule, water, shows a 1H NMR peak at around 0.5 ppm, 1.5 ppm, and 3.5 ppm when dissolved in benzene, chloroform, and dimethysulfoxide. OH peaks are extremely sensitive to the solvent. OH peaks can be even more confusing, because they sometimes don't even show up in the 1H NMR spectrum. Particularly under humid conditions, OH protons on alcohols and carboxylic acids can exchange or trade places with water in the sample. When they do that, their NMR peaks get wider and can even disappear altogether from the spectrum.
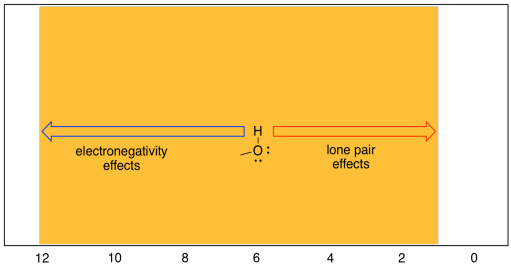
Figure NMR8.11. Chart showing the range of shifts for OH protons
The reason for this wide range has to do with the fact that, although oxygen is very electronegative (so its neighbouring hydrogen sshould be electron-poor) it also posesses lone pairs. Those lone pairs have the effect of shielding the hydrogen from the magnetic field. Thus, there are two competing effects in OH protons, and different situations tilt the balance one way or another.
- a proton attached to oxygen shows up between 1 and 12 ppm.
- hydroxy proton shifts can vary depending on factors such as hydrogen bonding with the solvent and other molecules.
- except for carboxylic acid protons, which occur beyond the normal range of other peaks, a peak showing up at a particular shift is not strong evidence for the presence of an OH proton.
Remember, these are general rules that you should know. There are exceptions. We already saw that the proton in chloroform shows up at 7 ppm although it is attached to a tetrahedral carbon, because it has three different, electronegative chlorines pulling it to the left. (World-record shifts occur for hydrogens attached to transition metals: "late" metals like ruthenium or rhodium can move hydrogen peaks all the way up to -20 ppm, but "early" metals like tantalum can move them down as far as 25 ppm.)
One more thing. If you have already looked at 13C NMR, notice a major difference between the two experiments is that a carbon spectrum is spread out over 200 ppm, while a typical proton spectrum is compressed into about 10 ppm. There is a consequence of that difference, and it can be frustrating. It is usually easy to distinguish two different 13C peaks, whereas two peaks in the 1H spectrum could easily be so close together that they overlap. For example, the aliphatic hydrocarbons hexane and nonane display only two distinct peaks in the 1H spectrum, one for the methyl hydrogens and one for the methylene hydrogens, because the latter are all too similar to tell apart given the limited amount of resolution in the spectrum.
- coincidental overlap of peaks in the 1H spectrum is common.
Problem NMR8.1.
Indicate whether each of the following peaks in the 1H NMR spectrum probably represents a hydrogen on a tetrahedral carbon (H-Csp3) or a hydrogen on a trigonal planar carbon (H-Csp2).
a) 1.1 ppm b) 3.4 ppm c) 7.8 ppm d) 4.2 ppm e) 5.7 ppm f) 9.9 ppm g) 2.3 ppm
Problem NMR8.2.
The following peaks in the 1H NMR spectrum represent hydrogen atoms on tetrahedral carbons (H-Csp3). Indicate whether that carbon is probably attached to another tetrahedral carbon, an oxygen, or a nitrogen.
a) 1.1 ppm b) 1.9 ppm c) 2.5 ppm d) 4.2 ppm e) 1.8 ppm f) 3.6 ppm g) 2.7 ppm
Problem NMR8.3.
Although aromatic C-H and alkene C-H are both bound to sp2 carbons the following peaks in the 1H NMR spectrum probably represent hydrogen atoms on alkene carbons or aromatic carbons.
a) 7.3 ppm b) 8.3 ppm c) 5.1 ppm d) 6.2 ppm e) 5.4 ppm f) 7.8 ppm
Problem NMR8.4.
The following peaks in the 1H NMR spectrum represent hydrogen atoms on trigonal planar carbons (H-Csp2). Indicate whether that carbon is probably attached to another trigonal planar carbon in an aromatic ring, is single-bonded to a nitrogen in an aromatic ring, or is double-bonded to an oxygen.
a) 7.1 ppm b) 6.9 ppm c) 8.5 ppm d) 10.2 ppm e) 9.8 ppm f) 8.2 ppm g) 7.9 ppm
Problem NMR 8.5.
Looking at the 1H NMR spectra of the following compounds, indicate which peak belongs to which proton.
a) dibutyl ether

b) methyl phenyl ether

c) benzaldehyde

d) acetophenone

Problem NMR8.6.
Sketch a 1H NMR spectrum for each of the following compounds, showing a simple line corresponding to the expected shift for each of the different hydrogens.

