Reactivity in Chemistry
Ligand Substitution in Coordination Complexes
LS4. Dissociative Mechanism and Kinetics
What about a dissociative reaction? Does it also depend on concentration?
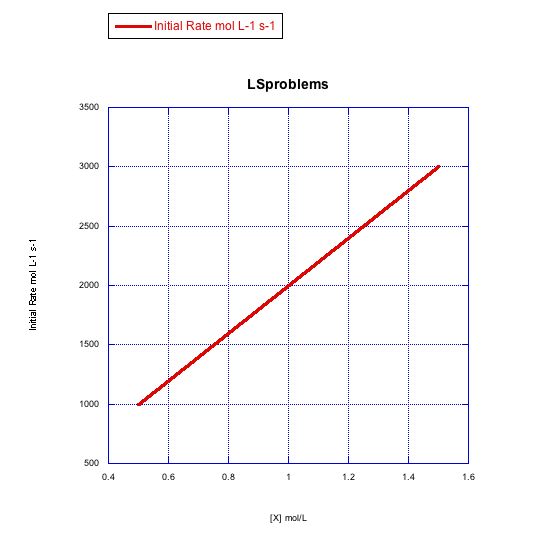
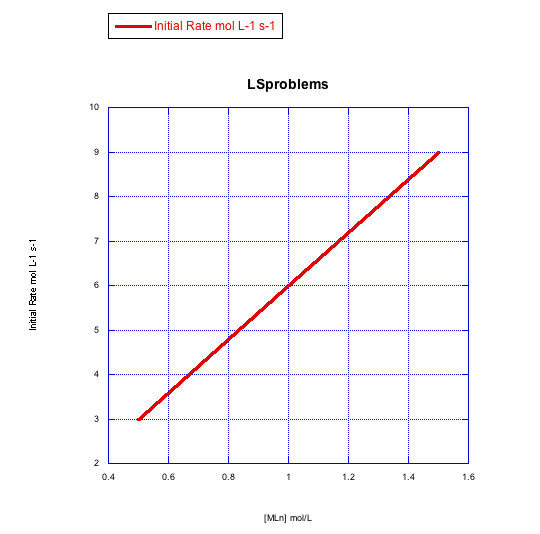
We could also change concentrations of the two reactants, the new ligand and the metal complex, in a dissociative reaction. If we did that, we would find a linear relationship between the concentration of metal complex and rate. If we doubled the amount of metal complex, the rate would double and so on.
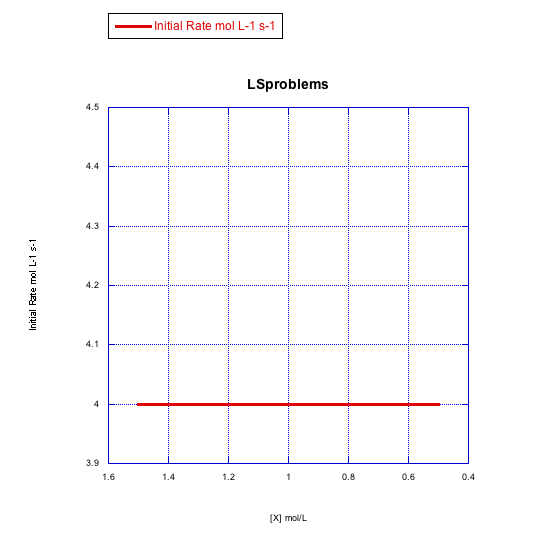
However, changes in concentration of the new ligand would have little effect on the rate. If we double the concentration of new ligand, the rate wouldn't change.
We can write the following expression, called the rate law, to describe this relationship:
Rate Law: Rate = -d[MLn]/dt = k[MLn]
This type of reaction is sometimes called a first order reaction. That means the rate law depends on only one concentration term.
Why does the dissociative mechanism depend on concentrations in this specific way?
This is a case of one molecule losing a ligand. Once it does so, a second ligand can replace the one that left. However, losing a ligand may be harder to do than gaining a new one. To lose a ligand, a bond must be broken, which costs energy. To gain a new ligand, a bond is made, releasing energy. That first step is harder to do, so it takes longer. It is a bottleneck that slows the reaction down. It is called the rate-determining step.
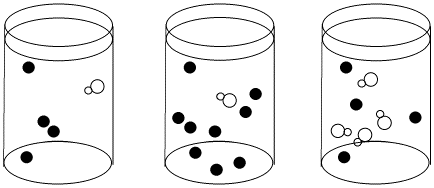
Figure LS5.1. A bottleneck in a reaction in the two cases on the left.
If the reaction must wait for the white molecule to dissociate, it doesn't matter how many black molecules there are; the reaction still goes just as slow. However, the more white molecules there are, the more frequently they will be able to react with the black molecules as dissociation occurs.
No collision is necessary for the metal complex to lose a ligand. Instead, a bond in the metal complex has to break. That just takes time and energy. As a result, concentrations matter very little.
We should think a little more about energy requirements, available energy and reaction rate. It takes a certain amount of energy to break a bond. Over any given period of time, a specific amount of energy is available in the surroundings to use. That energy is not available uniformly. Some molecules will get more energy from their surroundings and others will get less. There will be a statistical distribution, like a bell curve, of energy available in different molecules. That means bond-breaking events are governed by statistics.
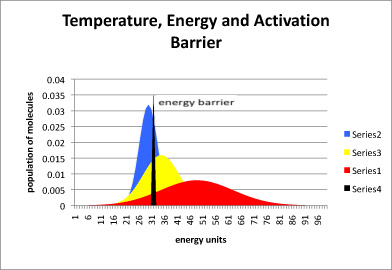
Figure LS5.2. The relationship between temperature, energy available, and energy barrier.
In the graph shown above, the black line represents energy needed to start the reaction, also called the energy barrier or the activation barrier. The blue curve is the distribution of available energy in a group of molecules at a cooler temperature. The yellow curve is for a group of molecules that is a little warmer, and the red curve even warmer.
In figure LS5.2, most of the molecules at the low temperature (blue) do not have enough energy to begin the reaction. A small portion do, and so the reaction will proceed, but very slowly. In the yellow curve, there is more energy available, and so a large fraction of molecules have the energy necessary to begin the reaction. In the red curve, the vast majority have sufficient energy to react. Thus, one of the factors governing how quickly a reaction will happen is the energy needed, or activation barrier. A second factor is the energy available, as indicated by the temperature.
Of course, even if there is enough energy for the reaction, the reaction might not occur yet. Energy is necessary but not sufficient to start a reaction. There are also statistical factors in terms of whether a molecule has its energy allotted into the right places, or in some cases, whether two molecules that need to react together are oriented properly.
Suppose at a given temperature it takes a specific amount of time for half the molecules to gain enough energy so that they can undergo the reaction. That amount of time is called the half life of the reaction. After one half life, half the molecules have reacted and half remain. After a second half life, half the remaining molecules (another quarter, for three quarters of the original material in all) have also reacted, and a quarter still remain. After a third half life, half the remaining ones (another eighth, making it seven eighths reacted in total) will have reacted, leaving an eighth of the original material behind.
Thus, the time it takes for the reaction to happen does not really depend on the concentration of anything.
However, the change in concentration over time -- the quantity that we can usually measure most easily -- depends on the original concentration, and for that reason the concentration of the metal complex appears in the rate law.
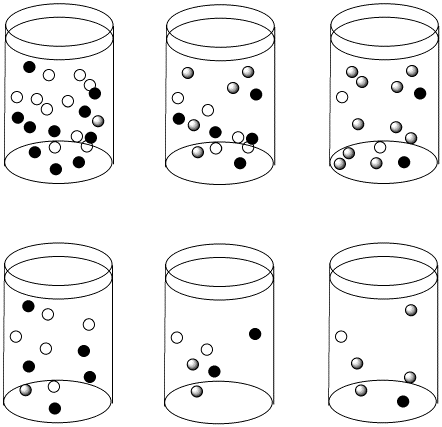
Figure LS4.3. The reactions in the top row and bottom row are proceeding with the same half-life as we move from left to right. However, the top row starts out more concentrated than the bottom row. As a result, the concentrations in the top row are changing more quickly than in the bottom row.
Suppose the half life for a particular case of ligand substitution is one second. After a half life, a 1 M solution becomes 0.5 M, so the rate of change in concentration per time is 0.5M/s. But after the same half life, a 0.5 M solution becomes 0.25 M, so the change in concentration is 0.25 M/s.
Problem LS4.1.
If a first order reaction has a half-life of 120 seconds, how much of the original material is left after
a) four minutes? b) six minutes? c) eight minutes? d) ten minutes?
Problem LS4.2.
Given the dissociative rate law above, what would happen to the reaction rate for substitution in each of the following cases?
Problem LS4.3.
Plot graphs of initial rate vs concentration to show what you would see in dissociative substitution.
a) The concentration of metal complex, [MLn], is held constant at 0.1 mol/L and the concentration of ligand is changed from 0.5 mol/L to 1 mol/L and then to 1.5 mol/L.
b) The concentration of new ligand, [X], is held constant at 0.1 mol/L and the concentration of metal complex is changed from 0.5 mol/L to 1 mol/L and then to 1.5 mol/L.
Problem LS4.4.
Given the following sets of initial rate data, determine whether each case represents a dissociative substitution. [MLn] = concentration of the coordination complex; [X] = concentration of incoming ligand.
a)
b)
Problem LS4.5.
In the following data, the concentration of the metal complex and the incoming ligand were held constant, but more of the departing ligand was added to the solution.
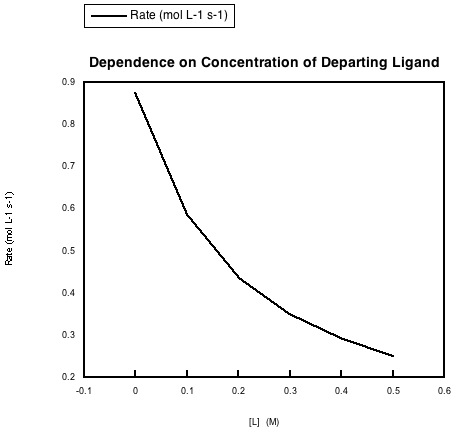
a) Explain what the data says about rate dependence on this concentration.
b) Explain this rate dependence in terms of the reaction.
Problem LS4.6.
In certain solvents, such as THF, acetonitrile and pyridine, the rate law for substitution often appears to be Rate = k1[MLn] + k2[MLn][X], in which X is the incoming ligand and MLn is the metal complex.
a) What do these solvents have in common?
b) What is a possible explanation for this rate law?
c) This rate law has been shown to be consistent with an entirely associative mechanism. How is that possible?
This site was written by Chris P. Schaller, Ph.D., College of Saint Benedict / Saint John's University (retired) with other authors as noted. It is freely available for educational use.

Structure & Reactivity in Organic, Biological and Inorganic Chemistry by Chris Schaller is licensed under a Creative Commons Attribution-NonCommercial 3.0 Unported License.
Send corrections to cschaller@csbsju.edu
This material is based upon work supported by the National Science Foundation under Grant No. 1043566.
Any opinions, findings, and conclusions or recommendations expressed in this material are those of the author(s) and do not necessarily reflect the views of the National Science Foundation.
Navigation:
Back to Ligand Substitution Index
Back to Web Materials on Structure & Reactivity in Chemistry