Biochemistry Online: An Approach Based on Chemical Logic

CHAPTER 5 - BINDING
A: INTRODUCTION TO REVERSIBLE BINDING
BIOCHEMISTRY - DR. JAKUBOWSKI
Last Update: 3/25/16
|
Learning Goals/Objectives for Chapter 5A: After class and this reading, students will be able to
|
A2. Interpretation of Binding Analyzes
It is important to get a mathematical understanding of the binding equations and graphs. It is equally important to get an intuitive understanding of their properties. Just as we used the +/- 2 rule in determining at a glance the charge state of an acid, you need to be able to determine the extent of binding (how much of M is bound with L) given their relative concentrations and the Kd. The usual situation is that [Mo] is << [Lo]. What happens to the binding curves for M + L <===> ML if the Kd gets progressively lower? Intuitively, you should expect that binding will increase, especially as L gets greater. The curves below should help you develop the intuition you need with respect to binding equilibria.
Fig: ML vs L at Even Lower Kd's
Fig: ML vs L at a Very Low Kd!
Note that in the last graph, given the same Mo and Lo concentrations, the "titration curves" for a binding equilibrium characterized by even tighter binding (for example, a Kd = 0.5 pM or 0.05 pM) would be indistinguishable from the graph when Kd = 5 pM. It should be apparent that for all of these Kd values, all of the added ligand is bound until [Lo] > [Mo]. To differentiate these cases, much lower ligand concentrations would be required such that on addition of ligand, all is not bound. Also note that this curve is NOT hyperbolic, which makes sense since the graph is of Y vs Lo, not Y vs L, and since Lo is not >> Mo.
![]() Wolfram
Mathematica CDF Player - Interactive Graph of Y vs L at two different Kd values
(free plugin required)
Wolfram
Mathematica CDF Player - Interactive Graph of Y vs L at two different Kd values
(free plugin required)
![]() Interactive SageMath
Graph: Y vs L at 2 different Kd values
Interactive SageMath
Graph: Y vs L at 2 different Kd values
It is quite interesting to compare graphs of Y (fractional saturation) vs L (free) and Y vs Lo (total L) in the special case when Lo is not >> Mo. Examples are shown below when Mo = 4 μM, Kd = 0.19 μM . Under the ligand concentration used, it should be apparent the L can't be approximated by Lo.
Figure: Y vs L and Y vs Lo when Lo is not >> Mo
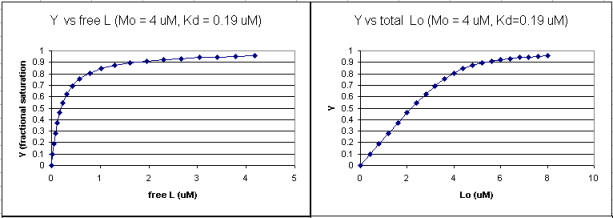
Two points should be evident from these graphs when L is not approximated by Lo:
-
a graph of Y vs Lo is not truly hyperbolic, but it does saturate
-
a Kd value (ligand concentration at half-maximal binding) can not be estimated by inspection from the Y vs Lo, but it can be from the Y vs L graph.
Fig: Comparison of Covalent Binding of Protons vs Noncovalent Binding of Ligand
 Navigation
Return to Chapter 5A: Introduction to Reversible Binding Sections
Return to Biochemistry Online Table of Contents
Archived version of full Chapter 5A: Introduction to Reversible Binding

Biochemistry Online by Henry Jakubowski is licensed under a Creative Commons Attribution-NonCommercial 4.0 International License.