Biochemistry Online: An Approach Based on Chemical Logic


BIOCHEMISTRY - DR. JAKUBOWSKI
Last Update: 3/25/16
|
Learning Goals/Objectives for Chapter 5A: After class and this reading, students will be able to
|
In the previous examples, we considered the case of a macromolecule M binding a ligand L at a single site, as described in the equation below:
M + L <==> ML
where Kd = [M][L]/[ML]
We saw that the binding curves (ML vs L or Y vs L are hyperbolic, with a Kd = L at half maximal binding.
Dimerization
A special, yet common example of this equilibrium occurs when a macromolecule binds itself to form a dimer, as shown below:
M + M <==> M2 or D
where D is the dimer, and where
Equation 11: Kd = [M][M]/[D] = [M]2/[D]
At first glance you would expect a graph of [D] vs [M] to be hyperbolic, with the Kd again equaling the [M] at half-maximal dimer concentration. This turns out to be true, but a simple derivation is in order since in the previous derivation, it was assumed that Mo was fixed and Lo varied. In the case of dimer formation, Mo, which superficially represents both M and L in the earlier derived expression, are both changing.
One again a mass balance expression for Mo can be written:
Equation 12: [Mo] = [M] + 2[D]
where the coefficient 2 is necessary since their are 2 M in each dimer.
More generally, for the case of formation of trimers (Tri), tetramers (Tetra), and other oligomers,
Equation 13: [Mo] = [M] + 2[D] + 3[Tri] + 4[Tetra] + ....
Rearranging (12) and solving for M gives
Equation 14: [M] = [Mo] -2[D]
Substituting (14) into the Kd expression (1) gives
Kd = (Mo-2D)(Mo-2D)/D where can be rearranged into quadratic form:
Equation 15: 4D2 - (4Mo+Kd)D + (Mo)2 = 0
which is of the form y = ax2+bx+c. Solving the quadratic equation gives [D] at any given [Mo]. A value Y, similar to fractional saturation, can be calculated, where Y is the fraction of total possible D, which can vary from 0-1.
Equation 16: Y = 2[D]/[Mo].
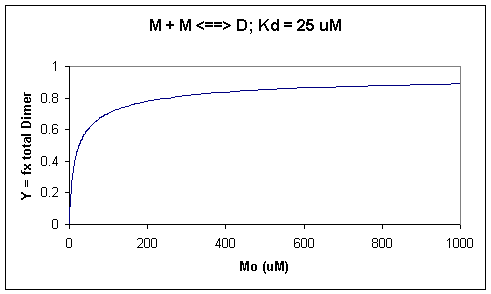
A graph of Y vs Mo with a dimerization dissociation constant Kd = 25 uM, is shown below.
Figure: Saturation binding curve for dimerization of a macromolecule

Note that the curve appears hyperbolic with half-maximal dimer formation occurring at a total M concentration Mo = Kd. Also note, however, that even at Mo = 1000 uM, which is 40x Kd, only 90% of the total possible D is formed (Y = 0.90). For the simple M + L <=> ML equilibrium, if Lo = 40x the Kd and Mo << Lo,
Y = L/(Kd+L) = L/[(L/40)+L] = 0.976
The aggregation state of a protein monomer is closely linked with its biological activity. For proteins that can form dimers, some are active in the monomeric state, while others are active as a dimer. High concentrations, such as found under conditions when protein are crystallized for x-ray structure analysis, can drive proteins into the dimeric state, which may lead to the false conclusion that the active protein is a dimer. Determination of the actual physiological concentration of [Mo] and Kd gives investigators knowledge of the Y value which can be correlated with biological activity. For example, interleukin 8, a chemokine which binds certain immune cells, exists as a dimer in x-ray and NMR structural determinations, but as a monomer at physiological concentrations. Hence the monomer, not the dimer, binds its receptors on immune cells. Viral proteases (herpes viral protease, HIV protease) are active in dimeric form, in which the active site is formed at the dimer interface.
![]() Wolfram
Mathematica CDF Player - Dimerization of Macromolecule (free
plugin required)
Wolfram
Mathematica CDF Player - Dimerization of Macromolecule (free
plugin required)
![]() Interactive SageMath
Graph: Dimerization of Macrmolecule
Interactive SageMath
Graph: Dimerization of Macrmolecule
Binding of a ligand to two independent sites
Another Special Case: Binding of L to 2 sites with different Kds
Check out the interactive graph to see how the relative sizes of the Kds affect it.
![]() Wolfram
Mathematica CDF Player - Binding of L to 2 Sites (free
plugin required)
Wolfram
Mathematica CDF Player - Binding of L to 2 Sites (free
plugin required)
![]() Interactive SageMath
Graph: Fractional Saturation 2 Independent Sites
Interactive SageMath
Graph: Fractional Saturation 2 Independent Sites
Navigation
Return to Chapter 5A: Introduction to Reversible Binding Sections
Return to Biochemistry Online Table of Contents
Archived version of full Chapter 5A: Introduction to Reversible Binding
