Biochemistry Online: An Approach Based on Chemical Logic

CHAPTER 9 - SIGNAL TRANSDUCTION
E: Metabolic Control Analysis and
Systems Biology
BIOCHEMISTRY - DR. JAKUBOWSKI
04/16/16
|
Learning Goals/Objectives for Chapter 9E:
|
E2. Basic
Principles of Metabolic Control Analysis (MCA)
A variety of inputs are required for such computational analyses:
a. Defined pathways. These are available in many databases. An examples
from KEGG pathways for yeast glycolysis is shown below
http://www.genome.jp/dbget-bin/www_bget?pathway:sce00010
b. A computational modeling program to input all parameters, equations, models and calculate concentrations for all species as a function of time. Free, downloadable programs that do that include COPASI, Virtual Cell, and Cell Designer. An example of a mapped model from Cell Designer for yeast glycolysis with several additional reactions branching off from the classical glycolytic pathway is shown below.
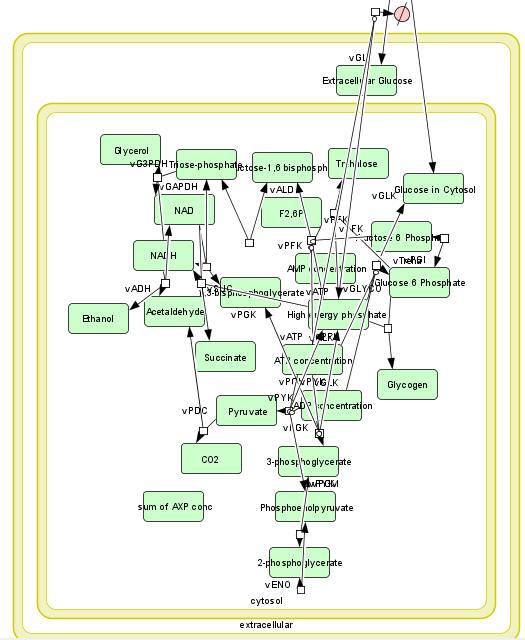
The computational results from the analyzes for yeast glycolysis were able to fit experimental data only if corrected by addition of several branching reactions (shown in the figures above and below):
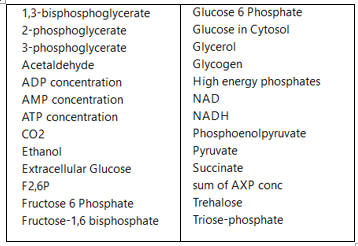
c. A list of all species involved in the pathway (shown in the figure below for glycolysis and branching reactions).
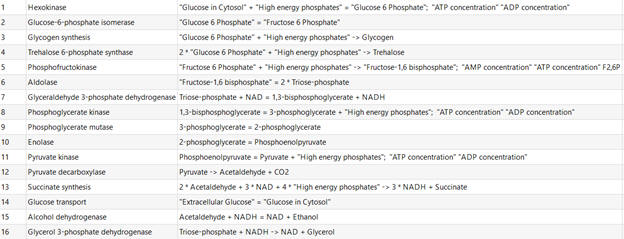
d. A list of all reactions (shown below for glycolysis and branching reactions, taken from COPASI)
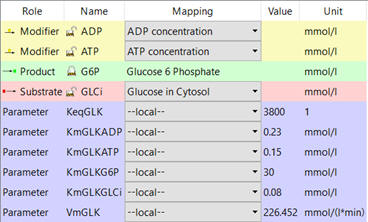
e. Parameters of all species. An example is shown below for hexokinase (taken from COPASI).
f. Equations that can be used to compute the change in concentrations of all species with time. These are usually ordinary differential equations (ODE) as described in Chapter 6B - Kinetics of Simple and Enzyme-Catalyzed Reactions, Sections B1: Single Step Reactions.) ODEs are easy to write but require a computer to solve as the number of interacting species increases.
An example chemical reaction and a set of ODEs for each species is
shown below.
If a reaction removes species X, the right side of the ODE for the disappearance of that species has a – sign for that term. Likewise, if a reaction increases species X, the right hand side has a + sign. The above examples show unimolecular (C to D, C to A + B) and bimolecular (A+B to C) reactions.
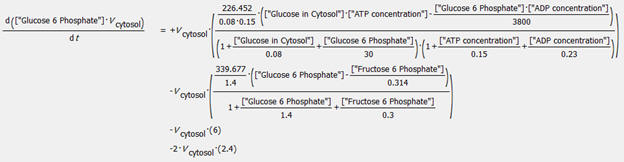
An example of an ODE taken from COPASI is shown below for the change
in concentration of glucose-6-phosphate.
Databases containing curated models with all above information have been
developed for many pathways. The yeast glycolysis model described above is
found in the Biomodels
Database. The model,
BIOMD0000000064, can be downloaded as a systems biology markup language
(SBML) file and imported into any of the programs described above.
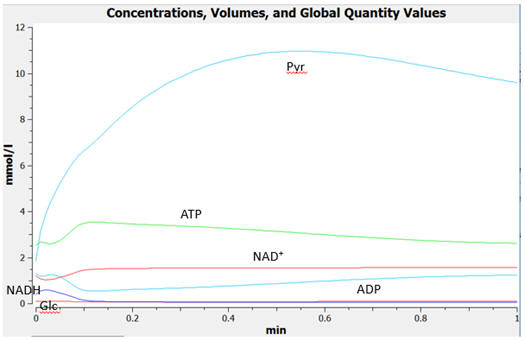
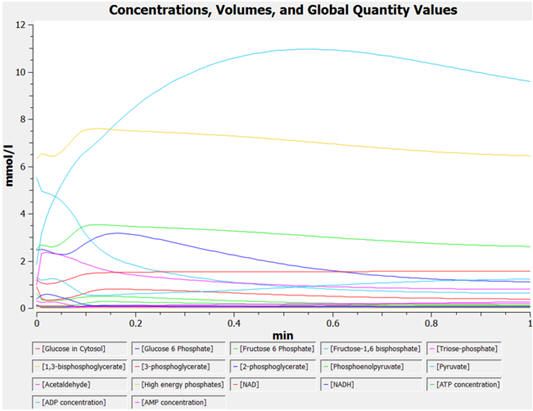
The
graphs below show the concentrations for select and all species as a
function of time for yeast glycolysis using COPASI.
 Navigation
Return to Chapter 9E: Metabolic Control Analysis and Systems Biology Sections
Return to Biochemistry Online Table of Contents

Biochemistry Online by Henry Jakubowski is licensed under a Creative Commons Attribution-NonCommercial 4.0 International License.