Biochemistry Online: An Approach Based on Chemical Logic

CHAPTER 9 - SIGNAL TRANSDUCTION
E: Metabolic Control Analysis and
Systems Biology
BIOCHEMISTRY - DR. JAKUBOWSKI
04/16/16
|
Learning Goals/Objectives for Chapter 9E:
|
E4. The Flux Control Coefficient
Metabolic control analysis is one way to address the complexity of
dynamic changes of species in a complex metabolic system. As such an
understanding of MCA would apply to complex signal transduction pathways as
well as to an understanding of the emerging discipline of systems biology.
In MCA external inputs (source) and outputs (exits) pools or reservoirs
exists which are connected to the internal metabolic enzymes, reactants and
products of the pathway connecting the two external reservoirs.
In studying complex metabolic systems, what is interesting to know is
not the Km or Vm of particular enzymes (such as those far from equilibrium
or catalyzing “rate limiting” steps based on in vitro studies), but rather
the control parameters (known as control coefficients) for the system. These
coefficients are properties of the whole pathway as an emerging system with
properties different from those of the individual steps. (For another
example of an emergent property, consider consciousness. It must emerge from
the incredible assembly of around 90 billion neurons in the brain forming
around 1015 synapses and cannot be predicts from the properties
of isolated neurons.) Three especially relevant parameters are the:
- Flux Control Coefficient
- Concentration Control Coefficient.
- Elasticity Coefficient
To understand how a pathway is regulated and how nature or for that matter scientists modify it to meet their demands, one needs to understand these coefficients to know which:
- parameters have the greatest effect (increase or decrease) on a preferred outcome;
- properties of the system make it most resilient or fragile;
- parameters should be measured most accurately
The Flux Control Coefficient (CJEi)
gives the relative fractional change in pathway flux J (dJ/J) (a system
variable) with fractional change in concentration or activity of an enzyme
Ei (dui/ui). The change in the concentration of an
enzyme can arise from increased synthesis or degradation of the enzyme, a
change in a modifier, a covalent modification, presence of inhibitor RNA,
mutations, etc.
Again, the word flux J is used to describe the rate of the system whereas
rate or velocity v is used to describe an individual enzyme in the system.
Think of u as “units” of activity”.
The Flux Control Coefficient (CJEi)
can also be written as
The dJ/du in the above equation suggests that the CJEi is equal to the slope of a plot of J vs u multiplied by u/J at that point. Alternatively it is the actual slope of a ln-ln plot of ln J vs ln u. A more formal definition would be obtained using partial derivatives:
CJEi clearly shows how the system flux changes with changes in activity of a single enzyme. The variable ui is a property of an enzyme (a local property) but J and concentrations (for the concentration coefficient – see below) are systems variables. Every enzyme in a pathway hence has its own flux control coefficient, CJEi. How are they related? It makes sense that the sum of all of the individual CJEi= 1 as the fractional change in flux, ∂J/J, is equal in magnitude to the fractional change in in all enzyme activities. This relationship, shown below, is called the Summation Theorem.
This equation would predict that if there were one magical enzyme X that was truly rate limiting and as such completely controlled that rate, then CJEx = 1 for that enzyme and 0 for all the rest. Yet this is counterintuitive since if all the enzymes are linked their responses should also be linked. Hence the control of flux is shared by all enzymes.
Another way to think about this is to consider a linear set of connected reactions. For these enzymes CJEi would vary between 0 and 1. If one enzyme was completely rate limiting, its CJEi would be 1 indicating that the fractional change in flux, ∂J/J, is equal to the fractional change in enzyme concentration (or activity) u, ∂u/u, for enzyme X. This implies that all change in flux is accounted for by the change in the concentration of enzyme X. This is a bit difficult to believe so it would make sense to think of the control of a pathway as being distributed over all the enzymes in the pathway. Plots of flux J vs enzyme activity u are similar to rectangular hyperbolas. Hence the flux coefficient changes with enzyme activity and with flux so at different fluxes, different enzyme flux coefficients would change as well. “Control” gets redistributed in the pathway.
Textbooks often describe that ideally the first step of a linear
pathway would be the committed step and be rate limiting. But think of this.
If the end product of a pathway feeds back and inhibits the first enzyme in
the pathway, then the last enzyme influences the first even though the last
is not considered “rate limiting”. Now if another enzyme removes the last
product and first enzyme feedback inhibitor of the pathway, that enzyme
determines flux as well. This again shows that flux control is distributed
throughout the system. The classical “rate limiting” enzyme might still have
the largest CJEi of the pathways, but if the system is
in the steady state, all enzymes have the same rate. Hence the term
“rate-limiting” is a bit useless in a pathway. Analysis of flux control
coefficients give a truly quantitative analysis of the system pathway.
Phosphfructokinase is said to be a “key” enzyme in glycolysis as it is one of three enzymes in the pathway that is characterized by a large negative free energy difference.
It is also highly regulated. However, Heinisch et al (Molecular and General Genetics, 202, 75-82) found that increasing its concentration 3.5 fold in fermenting yeast had no effect on flux of ethanol production.
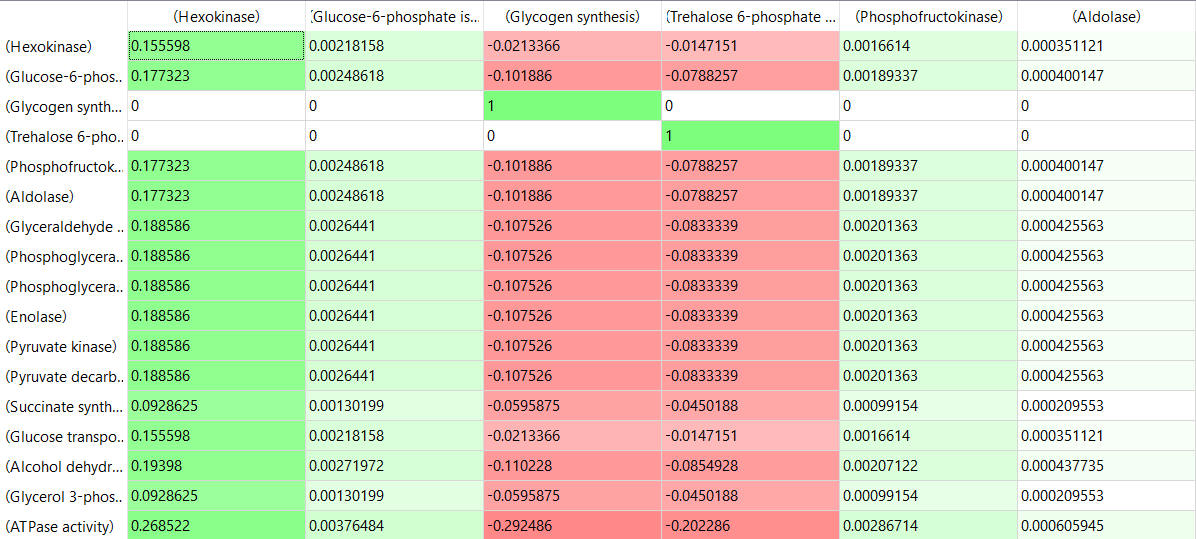
Here are some results of "sensitivity analyses" of yeast glycolysis showing the effect of small changes (up to 5%) on the flux control coefficients of glycolytic enyzems. The changes in the enzymes for these analyses are 1%. The numbers are scaled values which represent a relative change. A value of + 0.5 means that if the parameter is increased by 10%, the target value will increase by 5%. A column shows the rate of a reaction that is changed and the row indicates the flux of the reaction that has been affected. Green represent positive values and red negative with the intensity of the color correlating with the extent of the change. The table is split with column 1 of the first table applying to tables 2 and 3 as well.
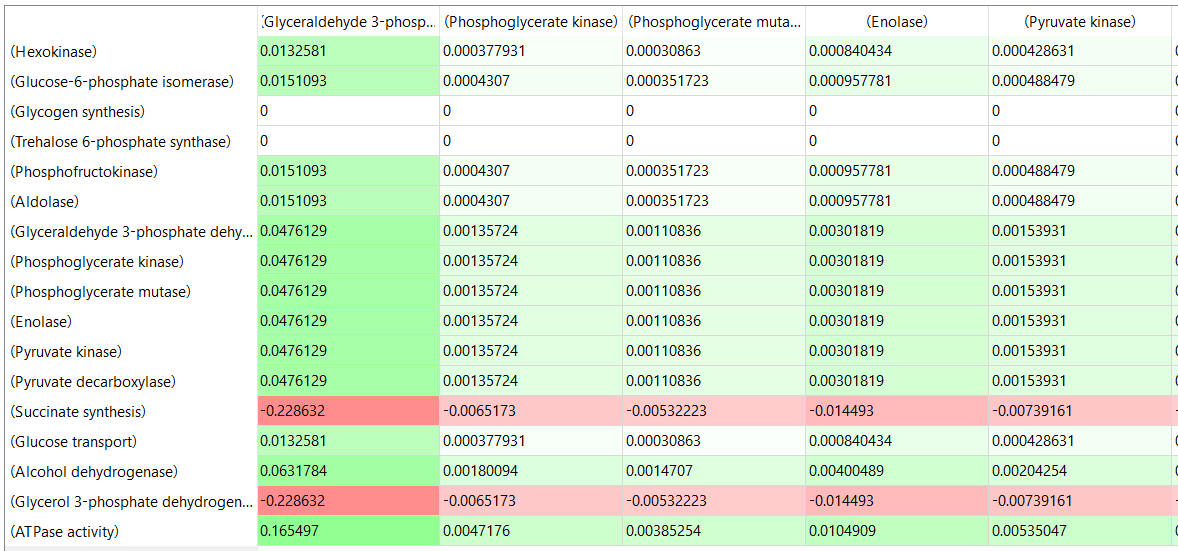
Table, part 2, continued:
table, part 3, continued
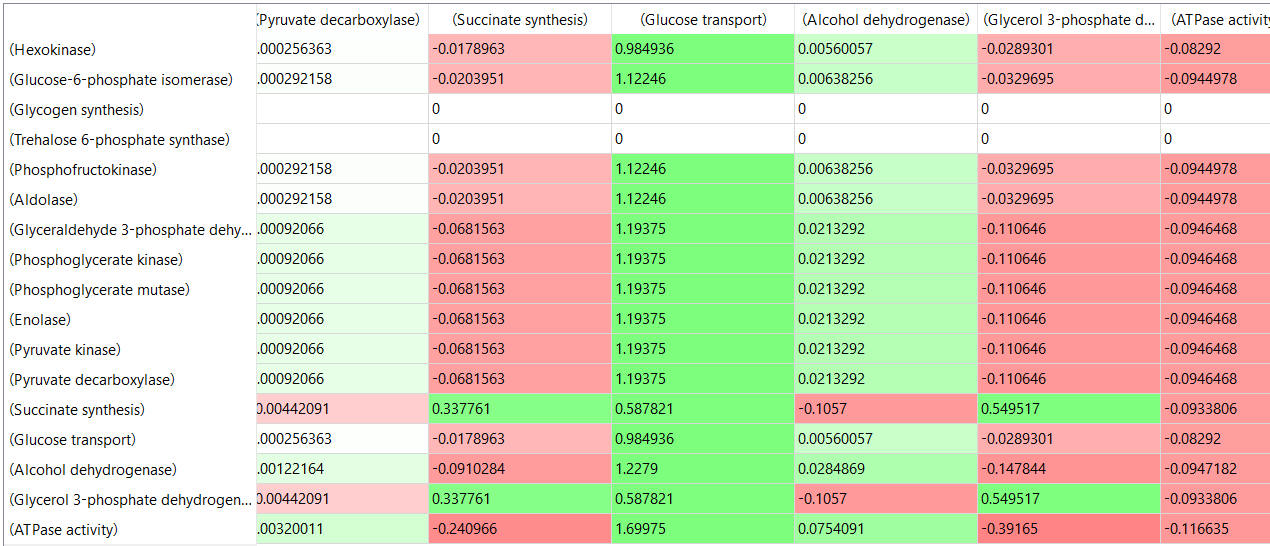
Some things to note:
- almost everything has changed in each column, which shows that a change in one enzyme affects all enzymes;
- 2 adjacent rows often have identical numbers since they describe two connected reactions (without branches) so their steady state fluxes will be the same;
- the sum of the CJEi values across the same row in both tables is 1 (summation theorem);
- perturbations of the "big 3" enzymes for steps 1,3, and 10 in glycolysis (hexokinase, phosphofructokinase, and pyruvate kinase), all of which proceed with a significant -ΔG0 and -ΔG, have minor effects on the flux.
It should be clear from these results that you can't predict the enzymes
that controls the flux without this kind of mathematical analysis. Don't
rely on just your "biochemical intuition".
 Navigation
Return to Chapter 9E: Metabolic Control Analysis and Systems Biology Sections
Return to Biochemistry Online Table of Contents

Biochemistry Online by Henry Jakubowski is licensed under a Creative Commons Attribution-NonCommercial 4.0 International License.