Biochemistry Online: An Approach Based on Chemical Logic

CHAPTER 9 - SIGNAL TRANSDUCTION
F: Signaling Math - Graphical Analyses
of Inputs and Outputs
Dr. Henry Jakubowski
![]() 11/16/17
New and slowly evolving ....
11/16/17
New and slowly evolving ....
|
Learning Goals/Objectives for Chapter 9F:
|
F1. Inputs, Outputs and Gates
We previously discussed the idea that enzymes should really be analyzed mathematically as part of complex synthetic/degradative or signal transduction system in which their biological effects (product formation, pathway regulation, etc.) are functions of ligand concentration and are subject to signals further upstream and downstream in their resident pathways. Hence we need to know in theory all the concentrations, rate constants, and dissociation constants for all the steps in the pathway. What would be helpful is a way to visualize the effects of changes in the concentrations of any target in a pathway with changes in the concentrations, rate and dissociation constants of other members in the linked pathways as a function of time.
This book has described many equations and graphs that describe "dose-responses" for a target with a small number of interacting species. Examples of different dose-response curves described by Bashor are shown below.
Curve A represents a typical response curve which could be produced by a process governed by a simple M + L <=> ML equilibrium. Curves B and C are sigmoidal and could be produced by a process governed by a multisubunit enzyme following the MWC model with different values for the parameters L and c. Curves D and E are similar to the output of consecutive irreversible reactions ( A --> B --> C) where the response is change in concentration with time. .
Although signaling systems are so intertwined and complicated, an understanding of common motifs in them could aid our understanding. For help in understanding complex biological networks, people have turned towards the language used to construct electronic circuits with inputs and outputs in common components.
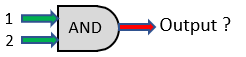
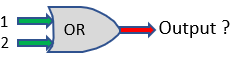
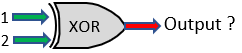
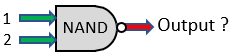
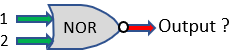
Boolean logic gates can be used to describe elecronic as well as signaling networks in which two inputs to a node in a network could produce multiple outputs. A biological example could be an enzyme that binds two substrates or one that is phosphorylated by a kinase at two separate sites. The figure below shows some common logic gates.
|
TYPE |
DIAGRAM |
RESPONSE
WITH INPUT |
|||||||||||||||
|
AND |
|
|
|||||||||||||||
|
OR |
|
|
|||||||||||||||
|
XOR Exclusive OR either/or |
|
|
|||||||||||||||
|
NAND AND followed by
NOT |
|
|
|||||||||||||||
|
NOR |
|
|
Biological networks could then be constructed with multiple logic gates, in analogy to electronic circuits.
Now lets put some biomolecules into small model systems and see how inputs into the system can give rise to a variety of outputs.
 Navigation
Return to Chapter 9F: Signaling Math - Graphical Analyses of Inputs and Outputs
Return to Biochemistry Online Table of Contents

Biochemistry Online by Henry Jakubowski is licensed under a Creative Commons Attribution-NonCommercial 4.0 International License.