Biochemistry Online: An Approach Based on Chemical Logic

CHAPTER 6 - TRANSPORT AND KINETICS
B: Kinetics of Simple and
Enzyme-Catalyzed Reactions
BIOCHEMISTRY - DR. JAKUBOWSKI
4/10/16
|
Learning Goals/Objectives for Chapter 6B: After class and this reading, students will be able to
|
1. Single Step Reactions
We will first explore the kinetics of non-catalyzed reactions as we did with our study of passive and facilitated diffusion. Before we do that, a brief review of the two major types of kinetic equations that you studied in general chemistry is in order. You learned two methods to analyze kinetic data:
-
initial velocity method: In this method, the initial rate, v0, is measured as a function of the concentration of reactants. The initial velocity, v0, is the initial slope of a graph of the concentration of reactants or products as a function of time, taken over a range of times such that only a small fraction of A has reacted. Under these condition, [A] over this short range of time is approximately constant and equal to Ao. Initial rate graphs are often based on measurement of product increase with time (dP/dt) so v0 vs A plots have positive slopes. The velocity at time t along the A vs t curve, dA/dt, is constantly changing as [A] decreases since the velocity depend on the [A]. To reiterate, the initial velocity of the reaction is the slope of the initial linear part of the decay curve when the rate is essentiallylinear over a narrow range of A concentrations.
-
integrated rate method: In this method a differential equation which gives the change of A or P with time (dA/dt or dP/dt) is integrated to give a rate equation giving the concentration of A or P as a function of time. .
REVIEW OF ELEMENTARY REACTION KINETICS
First Order Reaction:
![]()
where k1 is the first order rate constant. For these reactions, the velocity of the reaction, v, is directly proportional to [A], or
1a. v = -d[A]/dt = +d[P]/dT = k1[A].
The negative sign in -d[A]/dt indicates that the concentration of A decreases. The equation could also be written as:
1b. v = d[A]/dt = - k1[A].
| For the rest of the reactions shown in this chapter, I will follow the convention of writing all velocities expressed as d[x]/dt as positive numbers. A negative sign for a term on the right hand side of the differential equation (as in 1b) will indicate that the concentration dependency of that term will lead to an decrease in [x] with time. Likewise a positive sign for the term on the right hand side of the equation will indicate that concentration dependency of that term will lead to an increase in [x] with time. |
Using this nomenclature, the following differential equation can be written and solved to find [A] as a function of t.
dA/dt = -k1A
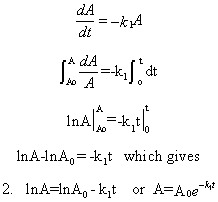
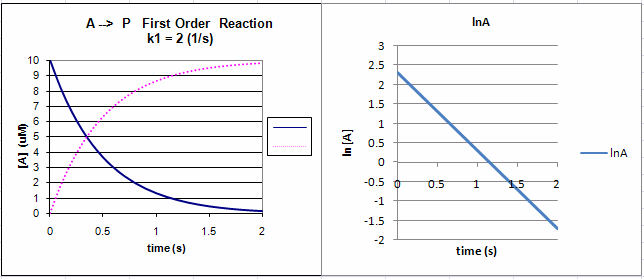
Equation 2 is an example of an integrated rate equation. The following graphs show plots of A vs t and lnA vs t for data from a first order process. Note that the derivative of the graph of A vs t (dA/dt) is the velocity of the reaction. The graph of lnA vs t is linear with a slope of -k1. The velocity of the reaction (slope of the A vs t curve) decreases with decreasing A, which is consistent with equation 1. Again, the initial velocity is determined from data taken in the first part of the decay curve when the rate is linear and little A has reacted. That is [A] is approximately equal to [A0].
Figure: First Order Reaction: A --> P
|
Once again, for complete clarification, another way of analyzing the kinetics of a reaction, in addition to following the concentration of a reactant or product as a function of time and fitting the data to an integrated rate equation, is to plot the initial velocity, vo, of the reaction as a function of concentration of reactants. The initial velocity is the initial slope of a graph of the concentration of reactants or products as a function of time, taken over a range of times such that only a small fraction of A has reacted, so [A] is approximately constant = Ao. From the first order graph of A vs t above, the slope approaches 0 with increasing time as [A] approaches 0, which clearly indicates that the reaction velocity depends on A. For a first order process, two equivalent equations, 1a and 1b, can be written. Equation 1a above is written showing the disappearance of A as v = -d[A]/dt = k1[A], while Equation 1b above is written showing the appearance of A as v = d[A]/dt = -k1[A], Both equations shows that v is directly proportional to A. As [A] is doubled, the initial velocity is doubled. Velocity graphs used by biochemists often show the initial velocity of product formation (not reactant decrease) as a function of reactant concentration. Hence, as the concentration of product is increasing, the slopes of initial velocity are positive. A graph of v (= dP/dt) vs [A] for a first order process would have a positive slope and be interpreted as showing that the rate of appearance of P depends linearly on [A]. |
Second Order/Pseudo First Order Reactions
![]()
where k2 is the second order rate constant. For the first of these irreversible reactions, the velocity of the reaction, v, is directly proportional to [A] and [B], or
3. v = d[A]/dt = d[B]/dt = -k2[A][B].
We will consider two special cases of this reaction type:
-
[B] >> [A]. Under these conditions, [B] never changes, so equation (3) becomes
4. v = -(k2[B]) [A] = -k1' [A]
where k1' is the pseudo first order rate constant (= k2[B] ) for the reaction. The reaction appears to be first order, depending only on [A].
-
The only reactant is A which must collide with another A to form P, as illustrated in the second reaction above. The derivations below apply to this special case.
The following differential equation can be written and solved to find [A] as a function of t.
5. v = d[A]/dt = +2d[P]/dT = -k2[A][A] = - k2[A]2
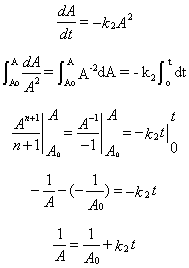
6. 1/A = 1/Ao + k2t
The following graphs show plots of A vs t and 1/A vs t for data from a second order process.
Figure: Second Order Reaction: A + A --> P
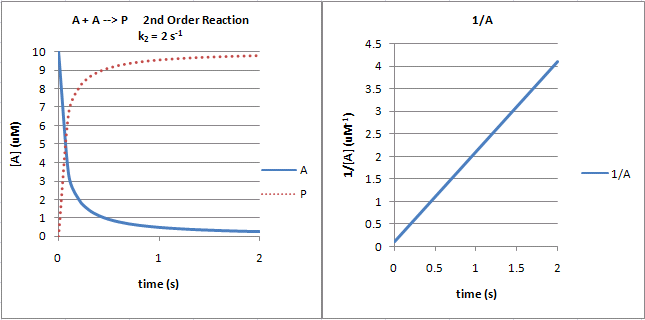
Note that just from a plot of A vs t, it would be difficult to distinguish a first from second order reaction. If the plots were superimposed, you would observe that at the same concentration of A (10 for example as in the linked plots), the vo of a first order reaction would be proportional to 10 but for a second order reaction to 102 or 100. Therefore, the second order reaction is faster (assuming similarity in the relative magnitude of the rate constants) as indicated by the steeper negative slope of the curve. However, at low A (0.1 example), the vo of a first order reaction would be proportional to 0.1 but for a second order reaction to 0.12 or 0.01. Therefore, at low A, the second order reaction is slower.
The interactive graphs below show the first and second order conversion of reactant A to product. Change the slides to see how the curves are different.
![]() 4/26/13
4/26/13![]() Wolfram
Mathematica CDF Player - Comparision of 1st and 2nd Order Conversion of A
--> P (First order - solid line; Second order - dashed line) (free
plugin required)
Wolfram
Mathematica CDF Player - Comparision of 1st and 2nd Order Conversion of A
--> P (First order - solid line; Second order - dashed line) (free
plugin required)
2. Multi-Step Reactions
Reversible First Order Reactions
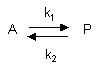
A differential equation can be written for this reaction:
7. v = d[A]/dt = -k1[A] + k2[P]
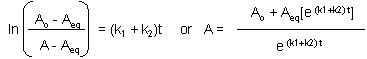
This can be solved through integration to give the following equations:
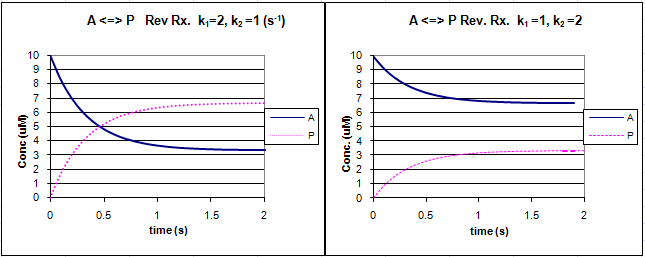
Graphs of A and P vs t for this reaction at two different sets of values of k1 and k2 are shown below.
Figure: Reversible First Order Reactions: A <=> P
![]() Xcel
Spread Sheet:
Reversible First Order Reactions
-
Xcel
Spread Sheet:
Reversible First Order Reactions
-
Go to the following spread sheet and change the values of k1 and k2. Note the changes in the graphs. Remember from our discussion of macromolecule:ligand binding, the dissociation constant, Kd, was related to the rate constants by the formula Kd = k2/k1. Note that if the first order rate constants for a reversible chemical reaction are equal, Keq (and its inverse) equal 1, and the equilibrium concentrations of A and P are equal.
![]() 4/26/13
4/26/13![]() Wolfram
Mathematica CDF Player - Reversible First Order Reactions ([A] blue,
[B] red) (free
plugin required)
Wolfram
Mathematica CDF Player - Reversible First Order Reactions ([A] blue,
[B] red) (free
plugin required)
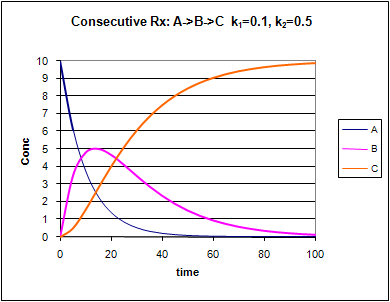
Consecutive First Order Reactions
![]()
For these reactions:
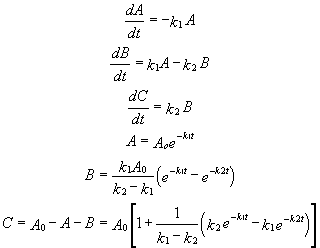
Graphs of A, B, and C vs t for these reaction at two different sets of values of k1 and k2 are shown below.
Figure: Consecutive Irreversible First Order Reactions: A --> B --> C
![]() Xcel
Spread Sheet:
Consecutive Reactions -
Xcel
Spread Sheet:
Consecutive Reactions -
Change the values of k1 and k2. Note the changes in the graphs.
![]() 4/26/13
4/26/13![]() Wolfram
Mathematica CDF Player - Irreversible Consecutive First Order Reactions ([A]
blue, [B] red, [C] orange (free
plugin required)
Wolfram
Mathematica CDF Player - Irreversible Consecutive First Order Reactions ([A]
blue, [B] red, [C] orange (free
plugin required)
![]() Reaction
Appliets:
Reaction
Appliets:
-
 Reactions
Kinetics: Java Applet - Zero, First, and Second Order
Reactions
Reactions
Kinetics: Java Applet - Zero, First, and Second Order
Reactions -
Graphical
determination of reaction order from initial rates
3. Rapid Equilibrium Enzyme-Catalyzed Reactions
We have previously derived equations for the reversible binding of a ligand to a macromolecule. Next we derived equations for the receptor-mediated facilitated transport of a molecule through a semipermeable membrane. This latter case extended the former case by the addition of a physical transport step. Now, in what hopefully will seem like d�j� vu, we will derive almost identical equations for the chemical transformation of a ligand, commonly referred to as a substrate, by an enzyme. Two scenarios will be studied.
- Rapid Equilibrium Assumption - enzyme E (macromolecule) and substrate S (ligand) concentrations can be determined using the dissociation constant since E, S, and ES are in rapid equilibrium, as we previously used in our derivation of the equations for facilitated transport. Sorry about the switch from A to S in designation of substrate. Biochemists use S to represent the substrate (ligand) but also use A, B, and P and Q to represent reactant and products in the case of multi-substrate and multi-product reactions.
- Steady State Assumption (more general) - enzyme and substrate concentrations are not those determined using the dissociation constant.
Enzyme kinetics experiments, as we will see in the next several chapters, must be used to determine the detailed mechanism of the catalyzed reaction. Using kinetics analyzes you can determine the order of binding/dissociation of substrates and products, the rate constants for individual steps, and clues as the to methods used by the enzyme in catalysis.
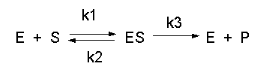
Consider the following reaction mechanism for the enzyme-catalyzed conversion of substrate S into product P. (We will assume that the catalyzed rate is much greater than the noncatalyzed rate.)
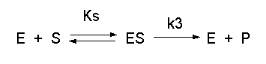
As we did for the derivation of the equations for the facilitated transport reactions under rapid equilibrium conditions, this derivation is based on the assumption that the relative concentrations of S, E, and ES can be determined by the dissociation constant, Ks, for the interactions and the concentrations of each species during the early part of the reaction (i.e. under initial rate conditions). Assume also the S >> Eo. Remember that under these conditions, S does not change much with time. Is this a valid assumption? Examine the mechanism shown above. S binds to E with a second order rate constant k1. ES has two fates. It can dissociate with a first order rate constant k2 to S + E, or it can be converted to product with a first order rate constant of k3 to give P + E. If we assume that k2 >> k3 (i.e. that the complex falls apart much more quickly than S is converted to P), then the relative ratios of S, E, and ES can be described by Ks. Alternatively, you can think about it this way. If S binds to E, most of S will dissociate, and a small amount will be converted to P. If it does, then E is now free, and will quickly bind S and reequilibrate since the most likely fate of bound S is to dissociate, not be converted to P (since k3 << k2). This make sense also, if you consider that the physical step characterized by k2 is likely to be quicker than the chemical step, characterized by k3. Hence the following assumptions have been used:
- S >> Eo
- Po = 0
- k3 is rate limiting (i.e. the slow step)
We would like to derive equations which show the velocity v as a function of the initial substrate concentration, So , (assuming that P is negligible over the time course of measuring the initial velocity). Also assume that the v catalyzed >> vnoncatalyzed. In contrast to the first-order reaction of S to P in the absence of E, v is not proportional to So but rather to Sbound. as we described in class with facilitated diffusion (flux proportional to AR, not free A). Therefore,
v α ES, or
Equation 1) v = const [ES] = k3 [ES]
where v is the velocity. How can we calculate ES when we know S (which is equal to So) and Etot (which is Eo)? Let us assume that S is much greater than E, as is the likely biological case. We can calculate ES using the following equations and the same procedure we used for the derivation of the binding equation, which gives the equation below:
ES = (EoS)/(Ks + S) (analogous to ML = (MoL)/(Kd + L)
DERIVATION
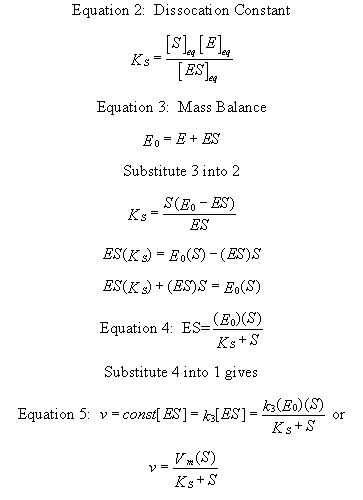
Equation 5) v = const [ES] = k3 [ES] = k3 EoS/(Ks + S) = VmS/(Ks + S).
This is the world famous Henri-Michaelis-Menten Equation
Just as in the case with noncatalyzed first order decay, it is easiest to measure the initial velocity of the reaction when [S] does not change much with time and the velocity is constant (i.e the slope of the dP/dt curve is constant). A plot of [P] vs t (called a progress curve) is made for each different substrate concentration studied. From these curves, the initial rates at each [S] is determined. Alternatively, one set reaction time is determined for all the different substrates concentrations that gives a linear rise in [P] with time. At the time, the reaction can be stopped (quenched) with a reagent that does not cause any change in S or P. Initial rates can be easily calculated for each [S] from a single data point in this case. i
- a plot of v vs S is hyperbolic
- v = 0 when S = 0
- v is a linear function of S when S<<Ks.
- v = Vmax (or Vm) when S is much greater than Ks
- S = Ks when v = Vmax/2.
These are the same conditions we detailed for our understanding of the binding equation
ML = (MoL)/(Kd + L)
The interactive Mathematics graph below allows you to change the relative value of Vm and Ks (which in the graph is given the more general name of Km). Note that when Km is not << S, the graph does not reach saturation and does not look hyperbolic. It should be apparent from the graph that only if S >> Km (or when S is approximately 100x greater than Km) will saturation be achieved.
![]() Wolfram
Mathematica CDF Player - Competitive Inhibition v vs S (free
plugin required)
Wolfram
Mathematica CDF Player - Competitive Inhibition v vs S (free
plugin required)
-
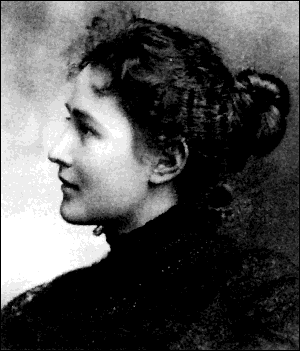
History
and Picture of
Maude Menten
As we saw in the graph of A or P vs t for a noncatalyzed, first order reaction, the velocity of the reaction, given as the slope of those curves, is always changing. Which velocity should we use in Equation 5? The answer invariably is the initial velocity measured in the early part of the reaction when little substrate is depleted. Hence v vs S curves for enzyme catalyzed reactions invariably are really v0 vs [S].
4. Steady State Enzyme-Catalyzed Reactions
In this derivation, we will consider the following equations and all the rate constants, and will not arbitrarily assume that k2 >> k3. We will still assume that S >> Eo and that Po = 0. An added assumption, however, is that dES/dt is approximately 0. Look at this assumption this way. When an excess of S is added to E, ES is formed. In the rapid equilibrium assumption, we assumed that it would fall back to E + S faster than it would go onto product. In this case, we will assume that it might go on to product either less or more quickly than it will fall back to E + S. In either case, a steady state concentration of ES arises within a few milliseconds, whose concentration does not change significantly during the initial part of the reaction under which the initial rates are measured. Therefore, dES/dt is about 0. In the rapid equilibrium derivation, we observed that v = k3ES. We then solved for ES using Ks and mass balance of E. In the steady state assumption, the equation v = k3ES still holds, but know we will solve for ES using the steady state assumption that dES/dt =0.
Equation 1) v = k3ES
Equation 6: (steady state) dES/dt = k1(E)(S) - k2(ES) -k3(ES) = 0
k1(E)(S) = (k2 + k3)(ES)
k1(Eo-ES)(S) = (k2 + k3)(ES)
k1(Eo)(S) - k1(ES)(S) = (k2 + k3)(ES)
k1(Eo)(S) = (k2 + k3)(ES) + k1(ES)(S)
k1(Eo)(S) = ES (k2 + k3 + k1S)
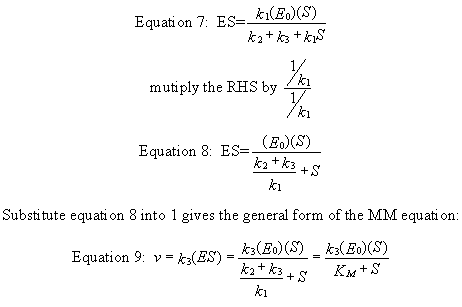
Equation 9) v = k3ES = [k3(Eo)(S)]/ [(k2 + k3)/k1 + S] = [k3(Eo)(S)]/(Km+ S)
5. Analysis of the General Michaelis-Menten Equation
This equation can be simplified and studied under different conditions. First notice that (k2 + k3)/k1 is a constant which is a function of relevant rate constants. This term is usually replaced by Km which is called the Michaelis constant (which was used in the Mathematica graph above). Likewise, when S approaches infinity (i.e. S >> Km, equation 5 becomes v = k3(Eo) which is also a constant, called Vm for maximal velocity. Substituting Vm and Km into equation 5 gives the simplified equation:
Equation 10) v = Vm(S)/(Km+ S)
It is extremely important to note that Km in the general equation does not equal the Ks, the dissociation constant used in the rapid equilibrium assumption! Km and Ks have the same units of molarity, however. A closer examination of Km shows that under the limiting case when k2 >> k3 (the rapid equilibrium assumption) then,
Equation 11) Km = (k2 + k3)/k1 = k2/k1 = Kd = Ks.
If we examine Equations 9 and 10 under several different scenarios, we can better understand the equation and the kinetic parameters:
- when S = 0, v = 0.
- when S >> Km, v = Vm = k3Eo. (i.e. v is zero order with respect to S and first order in E. Remember, k3 has units of s-1since it is a first order rate constant. k3 is often called the turnover number, because it describes how many molecules of S "turn over" to product per second.
- v = Vm/2, when S = Km.
- when S << Km, v = VmS/Km = k3EoS/Km (i.e. the reaction is bimolecular, dependent on both on S and E. k3/Km has units of M-1s-1, the same as a second order rate constant.
Notice that equations 9 and 10 are exactly analysis to the previous equations we derived:
- ML = MoL/(Kd + L) for binding of L to M
- Jo = JmA/(Kd + A) for rapid equilibrium binding and facilitated transport of A
- vo = VmS/(Ks + S) for rapid equilbirum binding and catalytic conversion of A to P.
- vo = Vm(S)/(Km+ S) for steady state binding and catalytic conversion of A to P.
Please notice that all these equations give hyperbolic dependencies of the y dependent variable (ML, Jo, and vo) on the ligand, solute, or substrate concentration, respectively.
![]()
![]() Java
Applet:
Michaelis-Menten Plots
Java
Applet:
Michaelis-Menten Plots
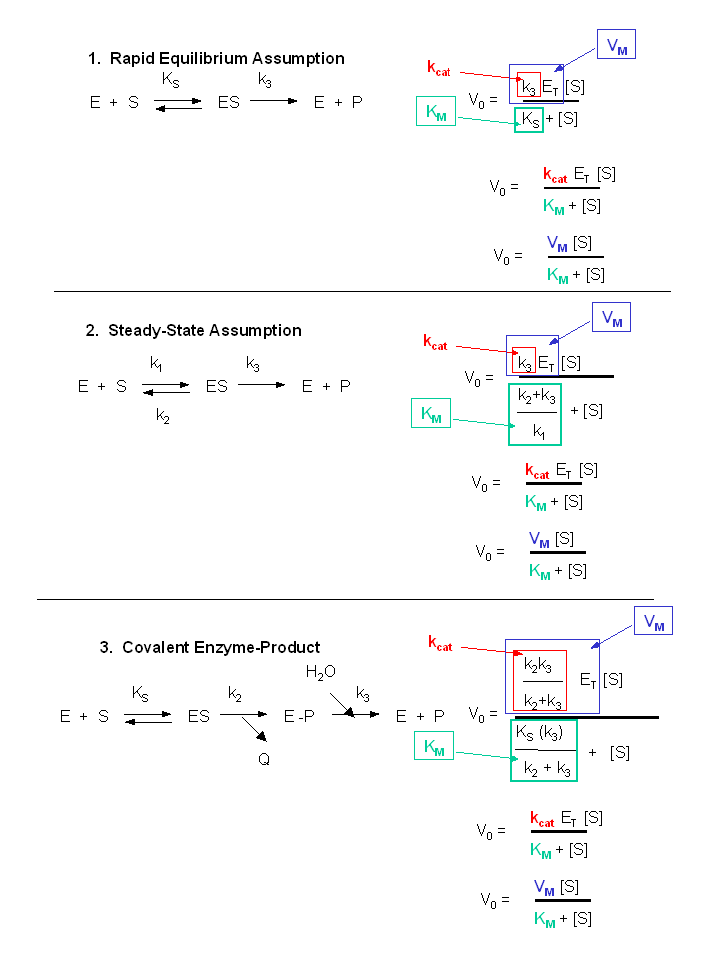
6. More Complicated Enzyme-catalyzed Reactions
Not all reactions can be characterized so simply as a simple substrate interacting with an enzyme to form an ES complex, which then turns over to form product. Sometimes, intermediates form. For example, a substrate S might interact with E to form a complex, which then is cleaved to products P and Q. Q is released from the enzyme, but P might stay covalently attached. This happens often in the hydrolytic cleavage of a peptide bond by a protease, when an activated nucleophile like Ser reacts with the sessile peptide bond in a nucleophilic substitution reaction, releasing the amine end of the former peptide bond as the leaving group, while the carboxy end of the peptide bond remains bonded to the Ser as an Ser-acyl intermediate. Water then enters and cleaves the acyl intermediate, freeing the carboxyl end of the original peptide bond. This is shown in the written reaction below:
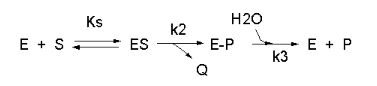
To simplify the derivation of the kinetic equation, let's assume that E, S, and ES are in rapid equilibrium defined by the dissociation constant, Ks. Assume Q has a visible absorbance, so it is easy to monitor. Assume from the steady state assumption that:
d[E-P]/dt = k2[ES] - k3[E-P] = 0 (assuming k3 is a pseudo first order rate constant and [H2O] doesn't change.
The velocity depends on which step is rate limiting. If k3<<k2, then the k3 step is rate-limiting. Then
v = k3[E-P]
If k2<<k3, then the k2 step is rate-limiting. Then
v = k2[ES]
For a homework assignment, you derived the following kinetic equation for this reaction, assuming v = k2[ES].
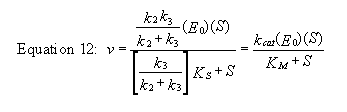
You can verify that you get the same equation if you assume that v = k3[E-P]. (Also, kcat will be defined below.)
This equation looks quite complicated, especially if you substitute for Ks, k-1/k1. All the kinetic constants can be expressed as functions of the individual rate constants. However this equation can be simplified by realizing the following:
- When S >> [Ks(k3)/(k2+k3)], v = [(k2k3)/(k2 + k3)]Eo = Vm
- [Ks(k3)/(k2+k3)] = constant = Km
Substituting these into equation 7 gives:
Equation 13) v = Vm(S)/(Km+ S)
This again is the general form of the Michaelis-Menten equation
Note in the first bulleted item above that for this reaction, Vm = [(k2k3)/(k2 + k3)]Eo
This is more complicated than our earlier definition of Vm = k3Eo. They are similar in that the term Eo is multiplied by a constant which is itself a function of rate constant(s). The rate constants are generally lumped together into a generic constant called kcat. For the simple reaction kcat = k3 but for the more complicated reaction with a covalent intermdiate which we just deived, kcat = (k2k3)/(k2 + k3). For all reactions,
Equation 14) Vm = kcatEo.
Figure: Summary of vo vs S equations - Meanings of Km, kcat and Vm.
7. Meaning of Kinetic Constants
It is important to get a "gut-level" understanding of the significance of the rate constants. Here they are:
-
Km: The Michaelis constant with units of molarity (M), is operationally defined as the substrate concentration at which the initial velocity is half of Vmax. It is equal to the dissociation constant of E and S only in if E, S and ES are in rapid equilibrium. It can be thought of as an "effective" Kd in other cases.
-
kcat: The catalytic rate constants, with units of s-1 is often called the turnover number. It is a measure of how many bound substrate molecules turnover or form product in 1 second. This is evident from equation v0 = kcat[ES]
-
kcat/Km: Under condition when [S] << Km, the Michaelis-Menten equation becomes v0 = (kcat/KM)[E0][S]. This really describes a biomolecular rate constant, with units of M-1s-1, for conversion of free substrate to product. Some enzyme have kcat/Km values around 108, indicating that they are diffusion controlled. That implies that the reaction is essentially done as soon as the enzyme and substrate collide. The constant kcat/Km is also referred to as the specificity constant in that it describes how well an enzyme can differentiate between two different competing substrates. (We will show this mathematically in the next chapter.)
Table: Km and kcat values for various enzymes
| Km values | ||
| enzyme | substrate | Km (mM) |
| catalase | H2O2 | 25 |
| hexokinase (brain) | ATP | 0.4 |
| D-Glucose | 0.05 | |
| D-Fructose | 1.5 | |
| carbonic anhydrase | HCO3- | 9 |
| chymotrypsin | glycyltyrosinylglycine | 108 |
| N-benzoyltyrosinamide | 2.5 | |
| b-galactosidase | D-lactose | 4.0 |
| threonine dehydratase | L-Thr | 5.0 |
| kcat values | ||
| enzyme | substrate | kcat (s-1) |
| catalase | H2O2 | 40,000,000 |
| carbonic anhydrase | HCO3- | 400,000 |
| acetylcholinesterase | acetylcholine | 140,000 |
| b-lactamase | benzylpenicillin | 2,000 |
| fumarase | fumarate | 800 |
| RecA protein (ATPase) | ATP | 0.4 |
Table: diffusion controlled enzymes
| Enzymes with kcat/Km values close to diffusion controlled (108 - 109 M-1s-1) | ||||
| enzyme | substrate | kcat (s-1) | Km (M) | kcat/Km (M-1s-1) |
| acetylcholinesterase | acetylcholine | 1.4 x 10⁴ | 9 x 10⁻⁵ | 1.6 x 10⁸ |
| carbonic anhydrase | CO2 | 1 x 10⁶ | 1.2 x 10⁻² | 8.3 x 10⁷ |
| HCO3- | 4 x 10⁵ | 2.6 x 10⁻² | 1.5 x 10⁷ | |
| catalase | H2O2 | 4 x 10⁷ | 1.1 | 4 x 10⁷ |
| crotonase | crotonyl-CoA | 5.7 x 10³ | 2 x 10⁻⁵ | 2.8 x 10⁸ |
| fumarase | fumarate | 8 x 10² | 5 x 10⁻⁶ | 1.6 x 10⁸ |
| malate | 9 x 10² | 2.5 x 10⁻⁵ | 3.6 x 10⁷ | |
| triose phosphate isomeraser | glyceraldehyde-3-P | 4.3 x 10³ | 4.7 x 10⁻⁴ | 2.4 x 10⁸ |
| b-lactamase | benzylpenicillin | 2.0 x 10³ | 2 x 10⁻⁴ | 1 x 10⁸ |
8. Experimental Determination of Vmax and Km
How can Vm and Km be determined from experimental data?
a. From initial rate data: The most common way is to determine initial rates, v0, from experimental values of P or S as a function of time. Hyperbolic graphs of v0 vs [S] can be fit be fit or transformed as we explored with the different mathematical transformations of the hyperbolic binding equation to determine Kd. These included:
-
nonlinear hyperbolic fit
-
double reciprocal plot
-
Scatchard plot
The double-reciprocal plot is commonly used to analyze initial velocity vs substrate concentration data. When used for such purposes, the graphs are referred to as Lineweaver-Burk plots, where plots of 1/v vs 1/S are straight lines with slope m = KM/Vmax, and y intercept b = 1/Vmax. These plots can not be analyzed using linear regression, however, since that method assumes constant error in the y axis (in this case 1/v) data. A weighted linear regression or even better, a nonlinear fit to a hyperbolic equation should be used. The Mathcad template below shows such a nonlinear fit. A rearrangement of the corresponding Scatchard equations in the Eadie-Hofstee plot is also commonly used, especially to visualize enzyme inhibition data as we will see in the next chapter.
![]() Mathcad 8 - Nonlinear Hyperbolic Fit. Vm and Km.
Mathcad 8 - Nonlinear Hyperbolic Fit. Vm and Km.
Common Error in Biochemistry Textbooks:
![]() The
Shape of the Hyperbola
The
Shape of the Hyperbola
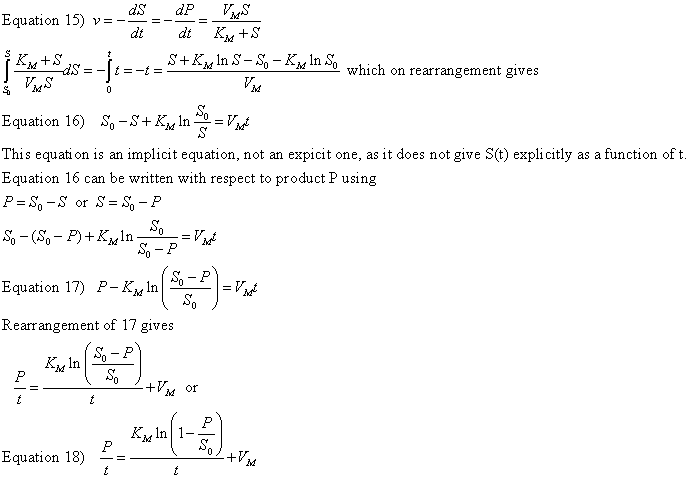
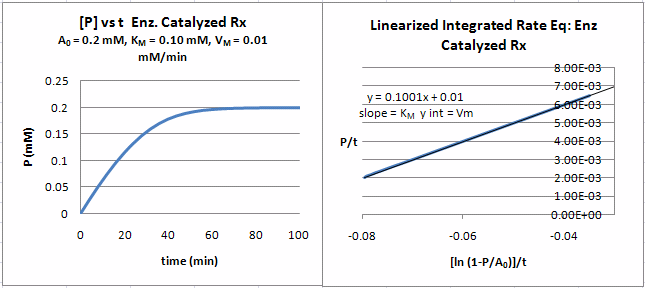
b. From integrated rate equations: KM and Vm can be extracted from progress curves of A or P as a function of t at one single A0 concentration by deriving an integrated rate equation for A or P as a function of t, as we did in equation 2 which shows the integrated rate equation for the conversion of A --> P in the absence of enzyme. In principle this method would be better than the initial rates methods. Why? One reason is that is not easy to be certain you are measuring the initial rate for each and every [S] which should vary over a wide range. It's also time intensive. In addition, think how much of the data is discarded if you take an entire progress curve at each substrate concentration, especially if you quench the reaction at a given time point, which effectively limits the data to one time point per substrate.
In practice, the mathematics are complicated as it is not possible to get
a simple explicit function of [P] or [S] as a function of time.
Nevertheless, progress has been made in progress curve analysis (no pun
intended). Let us consider the simple case of a single substrate S (or
A) being converted to product P in an enzyme catalyzed reaction. The
analogous equations for first order, non-catalyzed rates were
A=Aoe-k1t
or P = A0(1-e-k1t).
Now let's derive the equations for the enzyme-catalyzed reaction.
The derivation of the relevant equations are shown below.
A graph of P/t vs [ln (1-P/S0)]/t (shown below) from equation 18 gives a straight line with a slope of Km and a y intercept of Vm. Note that the calculated values of Vm and Km are derived from only one substrate concentration, and the values may be affected by product inhibition
Figure: Enzyme Kinetics Progress Curve
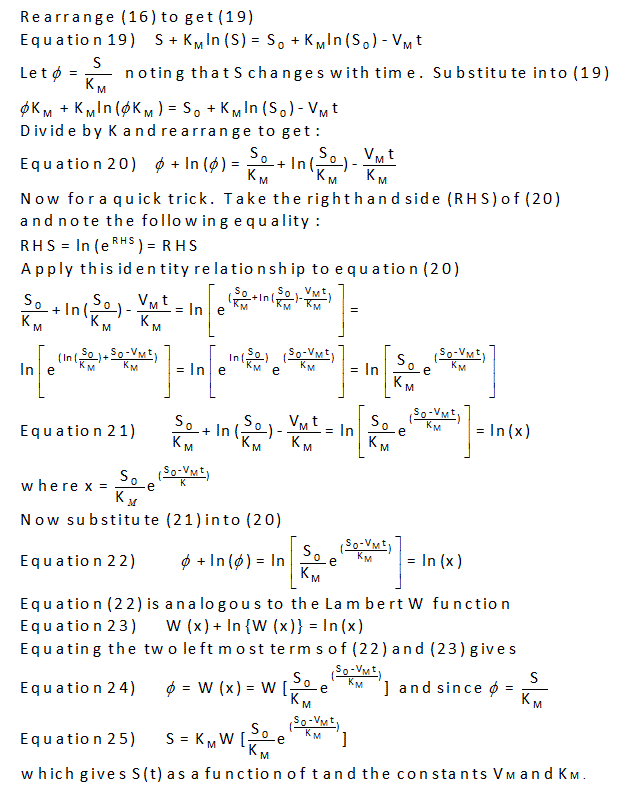
Can a simple explicit equation of P vs t be derived. The answer is no. However it can be represented by an explicit Lambert function as shown in the derivation below.

Biochemistry Online by Henry Jakubowski is licensed under a Creative Commons Attribution-NonCommercial 4.0 International License.